
African SaaS Categories, Pricing and Trial Data by Country
Which software categories are most common in South Africa, Nigeria, Kenya, Morocco, and Egypt? How much do their SaaS products cost, and how many offer free trials? Solevant's African SaaS category research examines 436 sampled software products across five countries, comparing their leading software categories, recorded monthly prices, free-trial availability, and product launch years. Enterprise Resource Planning leads South Africa's reported category list, Human Resources ranks first in Nigeria, and Kenya has a tie between Business Intelligence and Employee Engagement.
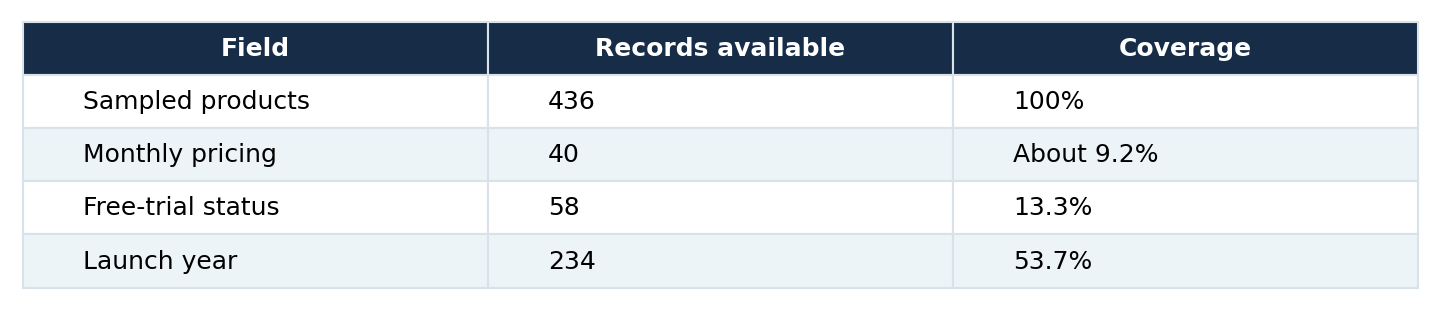
Monthly prices are recorded for only 40 products, free-trial status is known for just 58, and launch years are available for 234. These limitations matter because a percentage calculated from a small subset can be very different from the percentage represented across the full catalog.
Key Findings
- The research covers 436 sampled SaaS products across South Africa, Nigeria, Kenya, Morocco, and Egypt.
- Enterprise Resource Planning leads South Africa, with 22 products in the reported category list.
- Human Resources leads Nigeria, with 18 products, followed by Payment Processing with nine.
- Kenya's leading categories are Business Intelligence and Employee Engagement, with six products each.
- SMS Marketing leads Morocco with five products, while Banking Systems leads Egypt with three.
- Only 40 products—approximately 9.2% of the sample—have recorded monthly prices. Their reported average is $88.18.
- Free-trial status is known for 58 products. Of those, 42 (72.41%) are marked as offering a free trial.
- Those same 42 products represent only 9.63% of the full 436-product sample.
- Launch years are recorded for 234 products (53.7%). Among years with exact counts supplied, 2014 has the highest figure, with 19 launches.
Which SaaS Categories Lead in African Countries?
The five countries have different leading software categories in Solevant's prepared analysis. South Africa's reported list is led by ERP, Nigeria's by Human Resources, Kenya's by Business Intelligence and Employee Engagement, Morocco's by SMS Marketing, and Egypt's by Banking Systems.
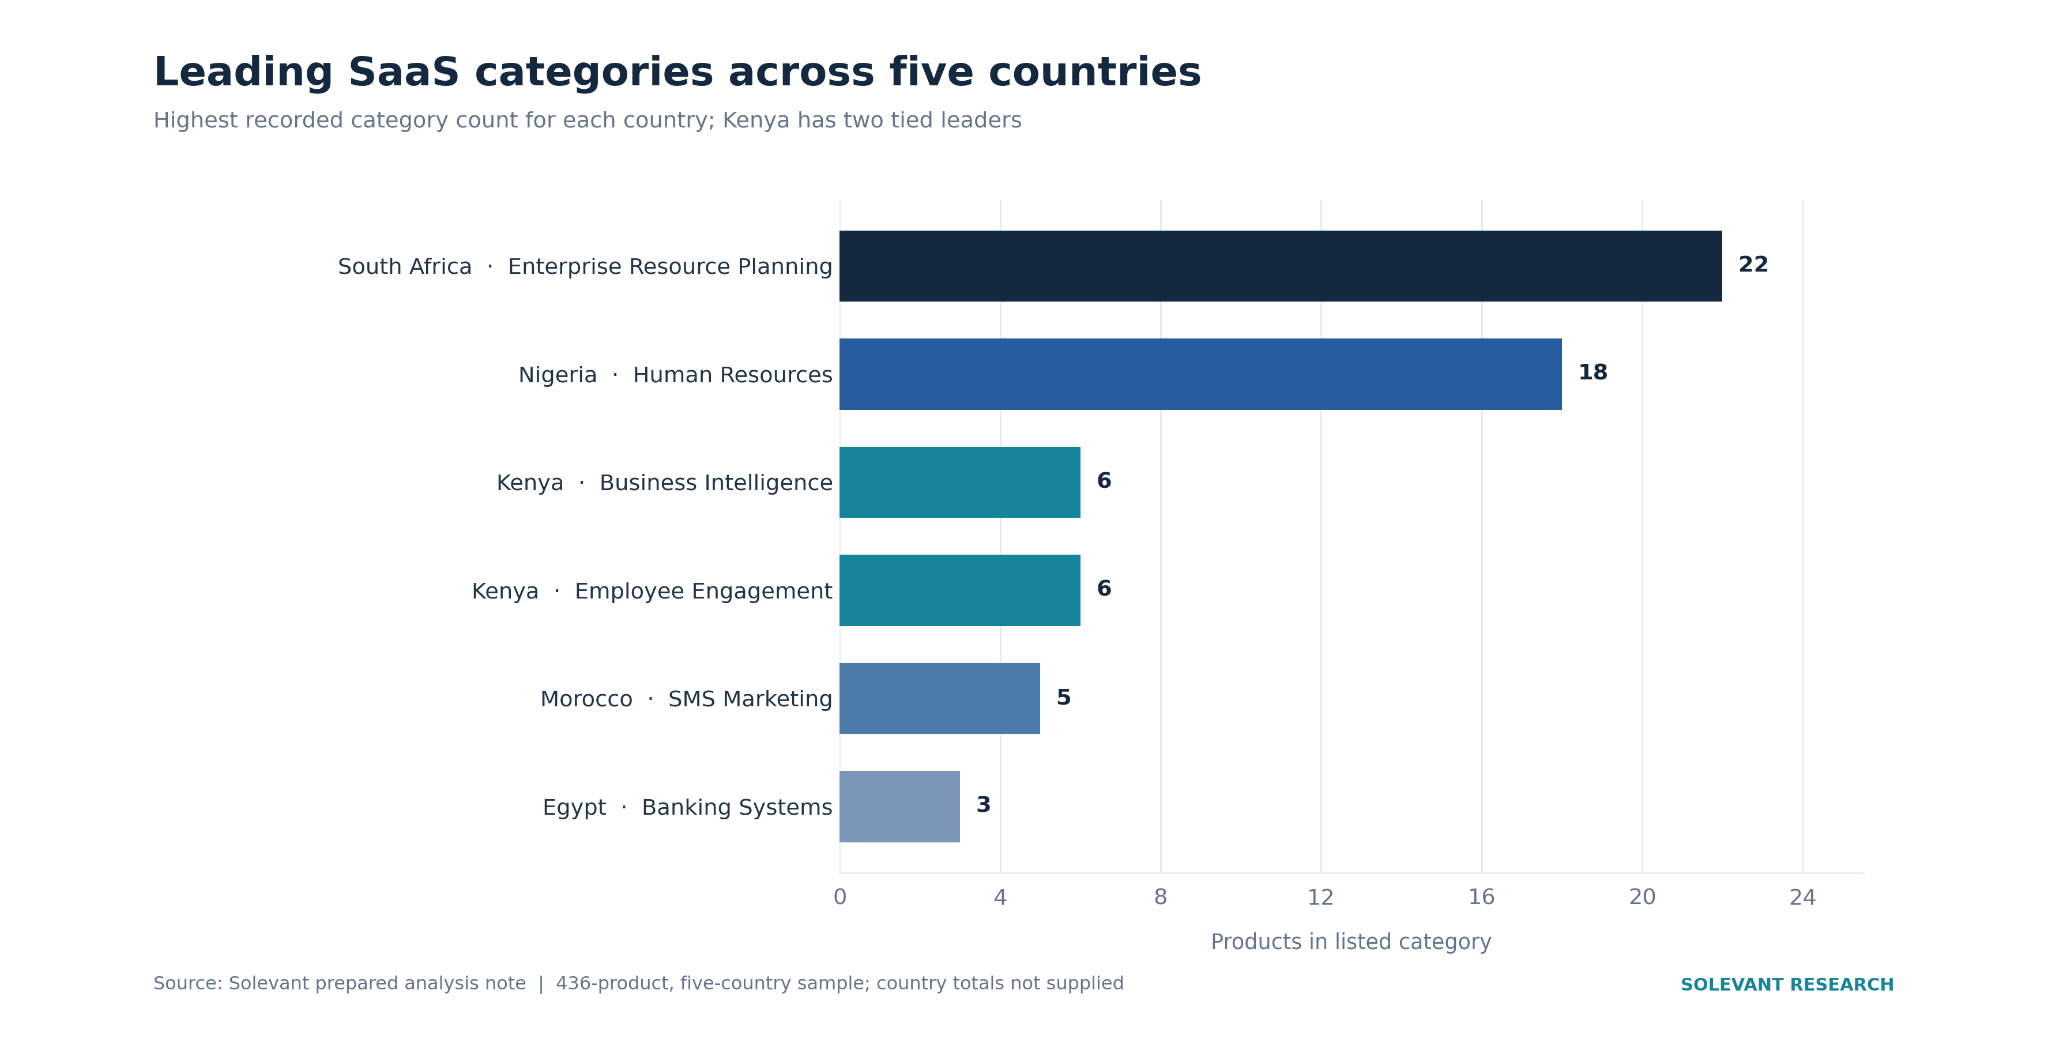
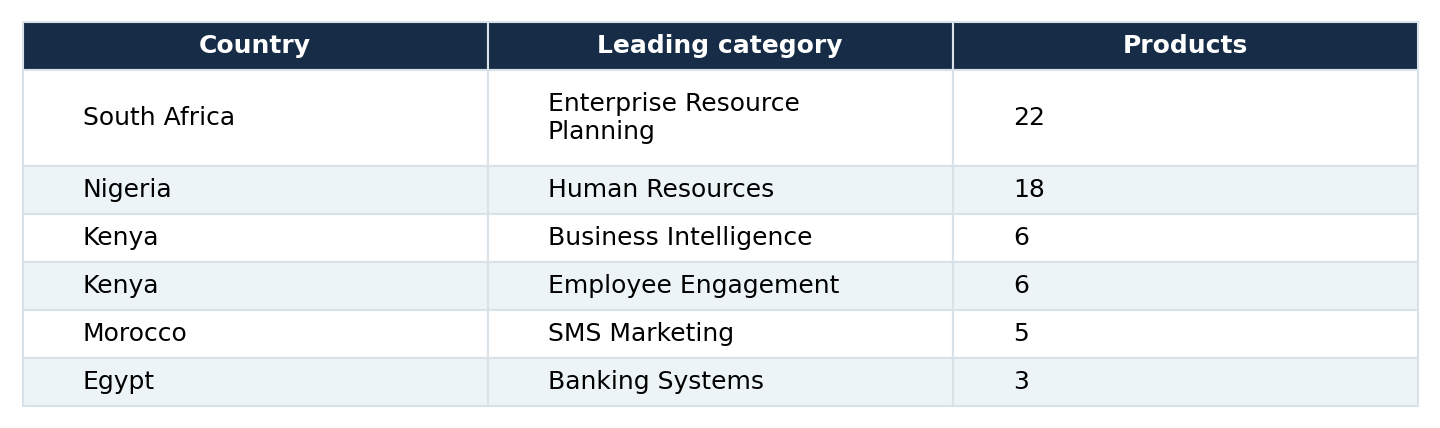
These counts are useful for comparing the leading categories reported for each country. However, the source does not provide the total number of sampled products in each individual country. As a result, the figures cannot be converted into reliable country-level market shares or used to rank the five countries by the overall size of their SaaS catalogs. They describe the categories included in the source note, not necessarily every product or category present in each country.
South Africa SaaS Categories: ERP Leads the List
Enterprise Resource Planning is the leading category in South Africa's reported SaaS breakdown, with 22 products. Billing and Invoicing ranks second with 12, followed by CRM with eight. Learning Management Systems and Accounting each have seven products.
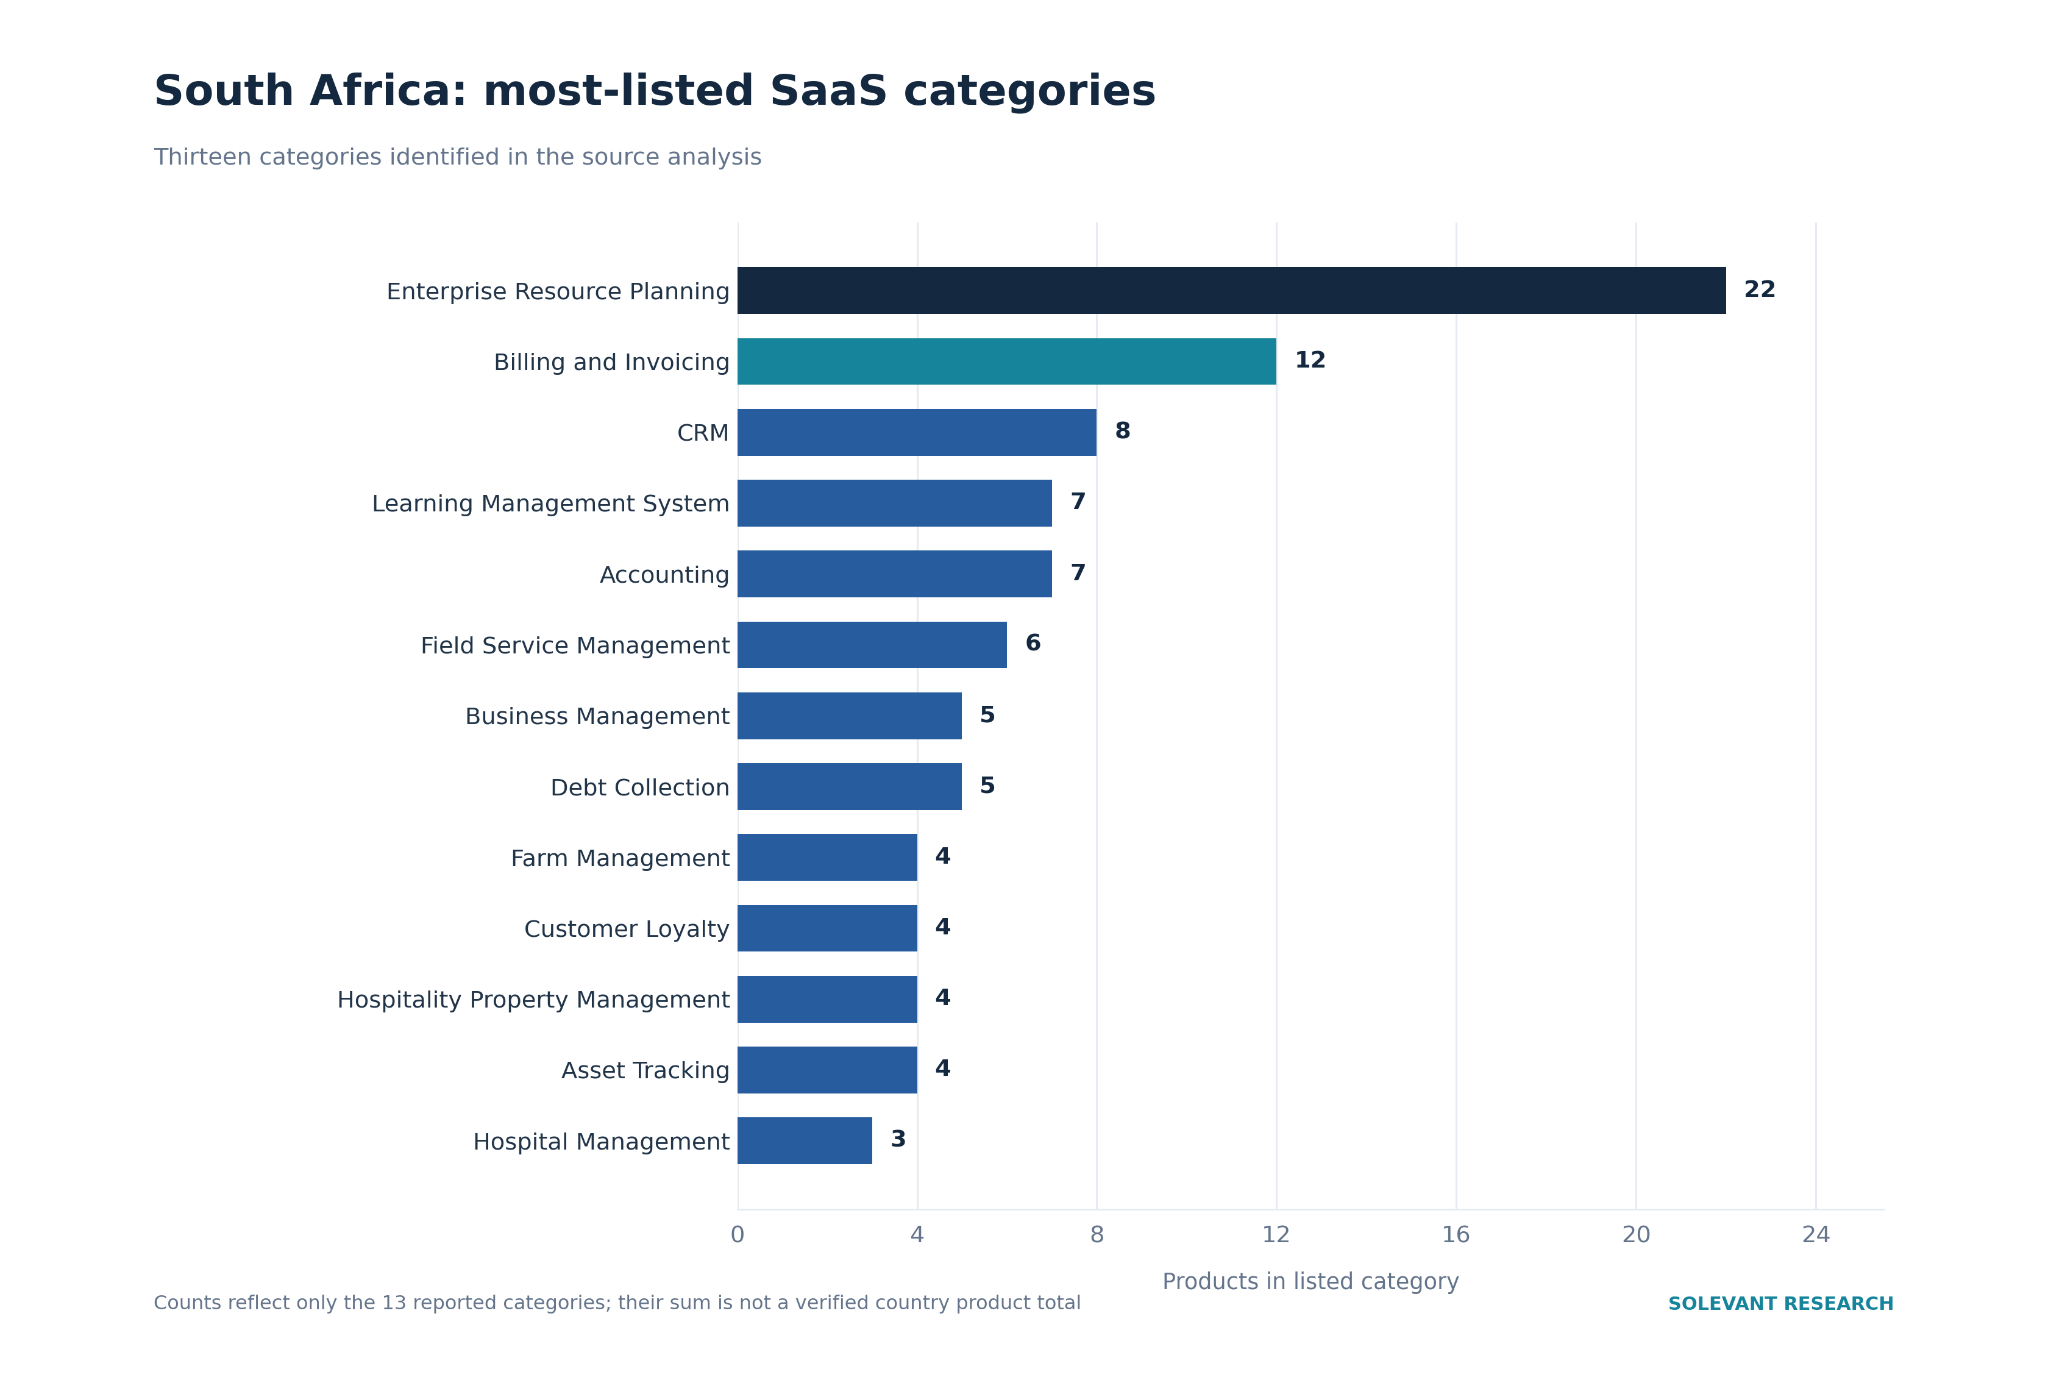
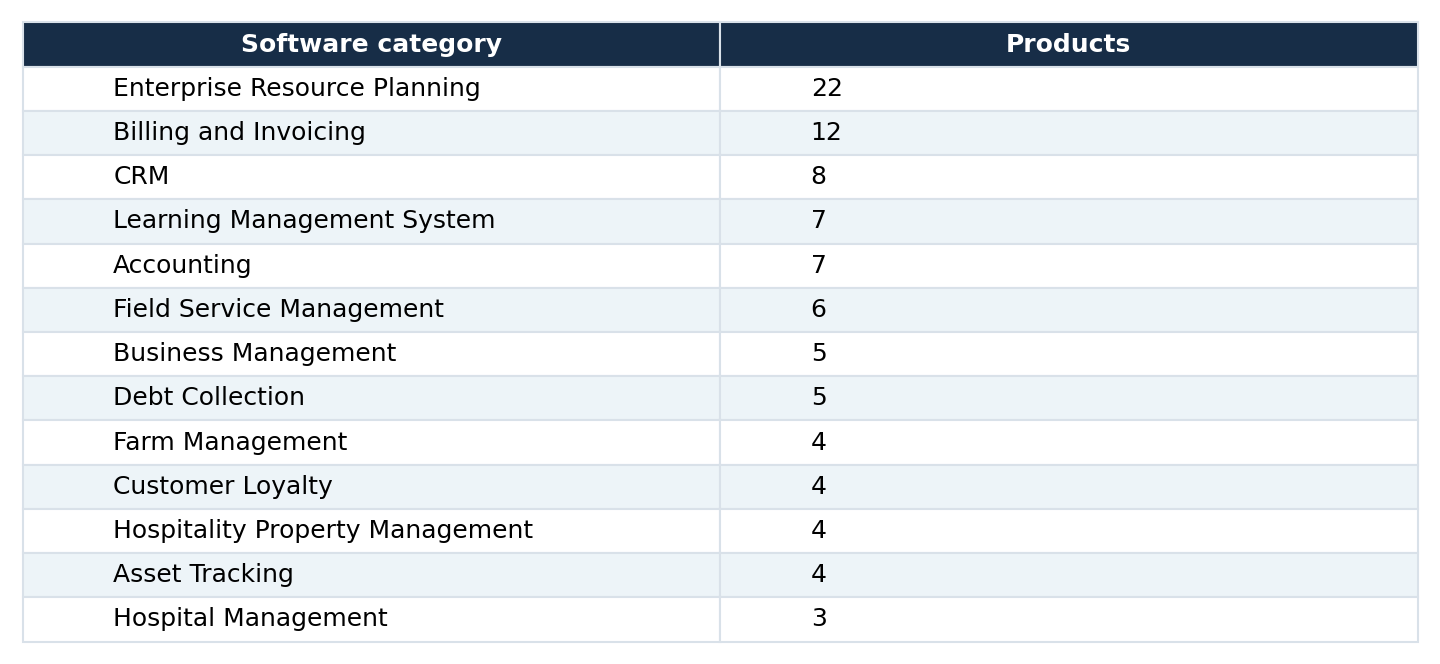
ERP's 22 listings are substantially higher than the 12 recorded for Billing and Invoicing. The category list also includes financial administration, customer management, education, agriculture, hospitality, and healthcare software. This shows that the reported products cover several business functions. The 13 category counts sum to 91, but that figure should not be interpreted as South Africa's complete product total. The source provides a list of leading categories rather than a verified full-country count.
What Does ERP's Lead Tell Us?
ERP is the most frequently listed category in South Africa's supplied breakdown. That is a valid observation about the sample. It does not establish that ERP generates the most SaaS revenue, has the highest adoption rate, or attracts the most investment in South Africa. Those conclusions would require additional data on customers, spending, and market coverage.
Nigeria SaaS Categories: Human Resources and Payments Stand Out
Nigeria's category breakdown is led by Human Resources, with 18 products. Payment Processing follows with nine, while Fleet Management ranks third with seven. The remaining listed categories have between two and three products each.
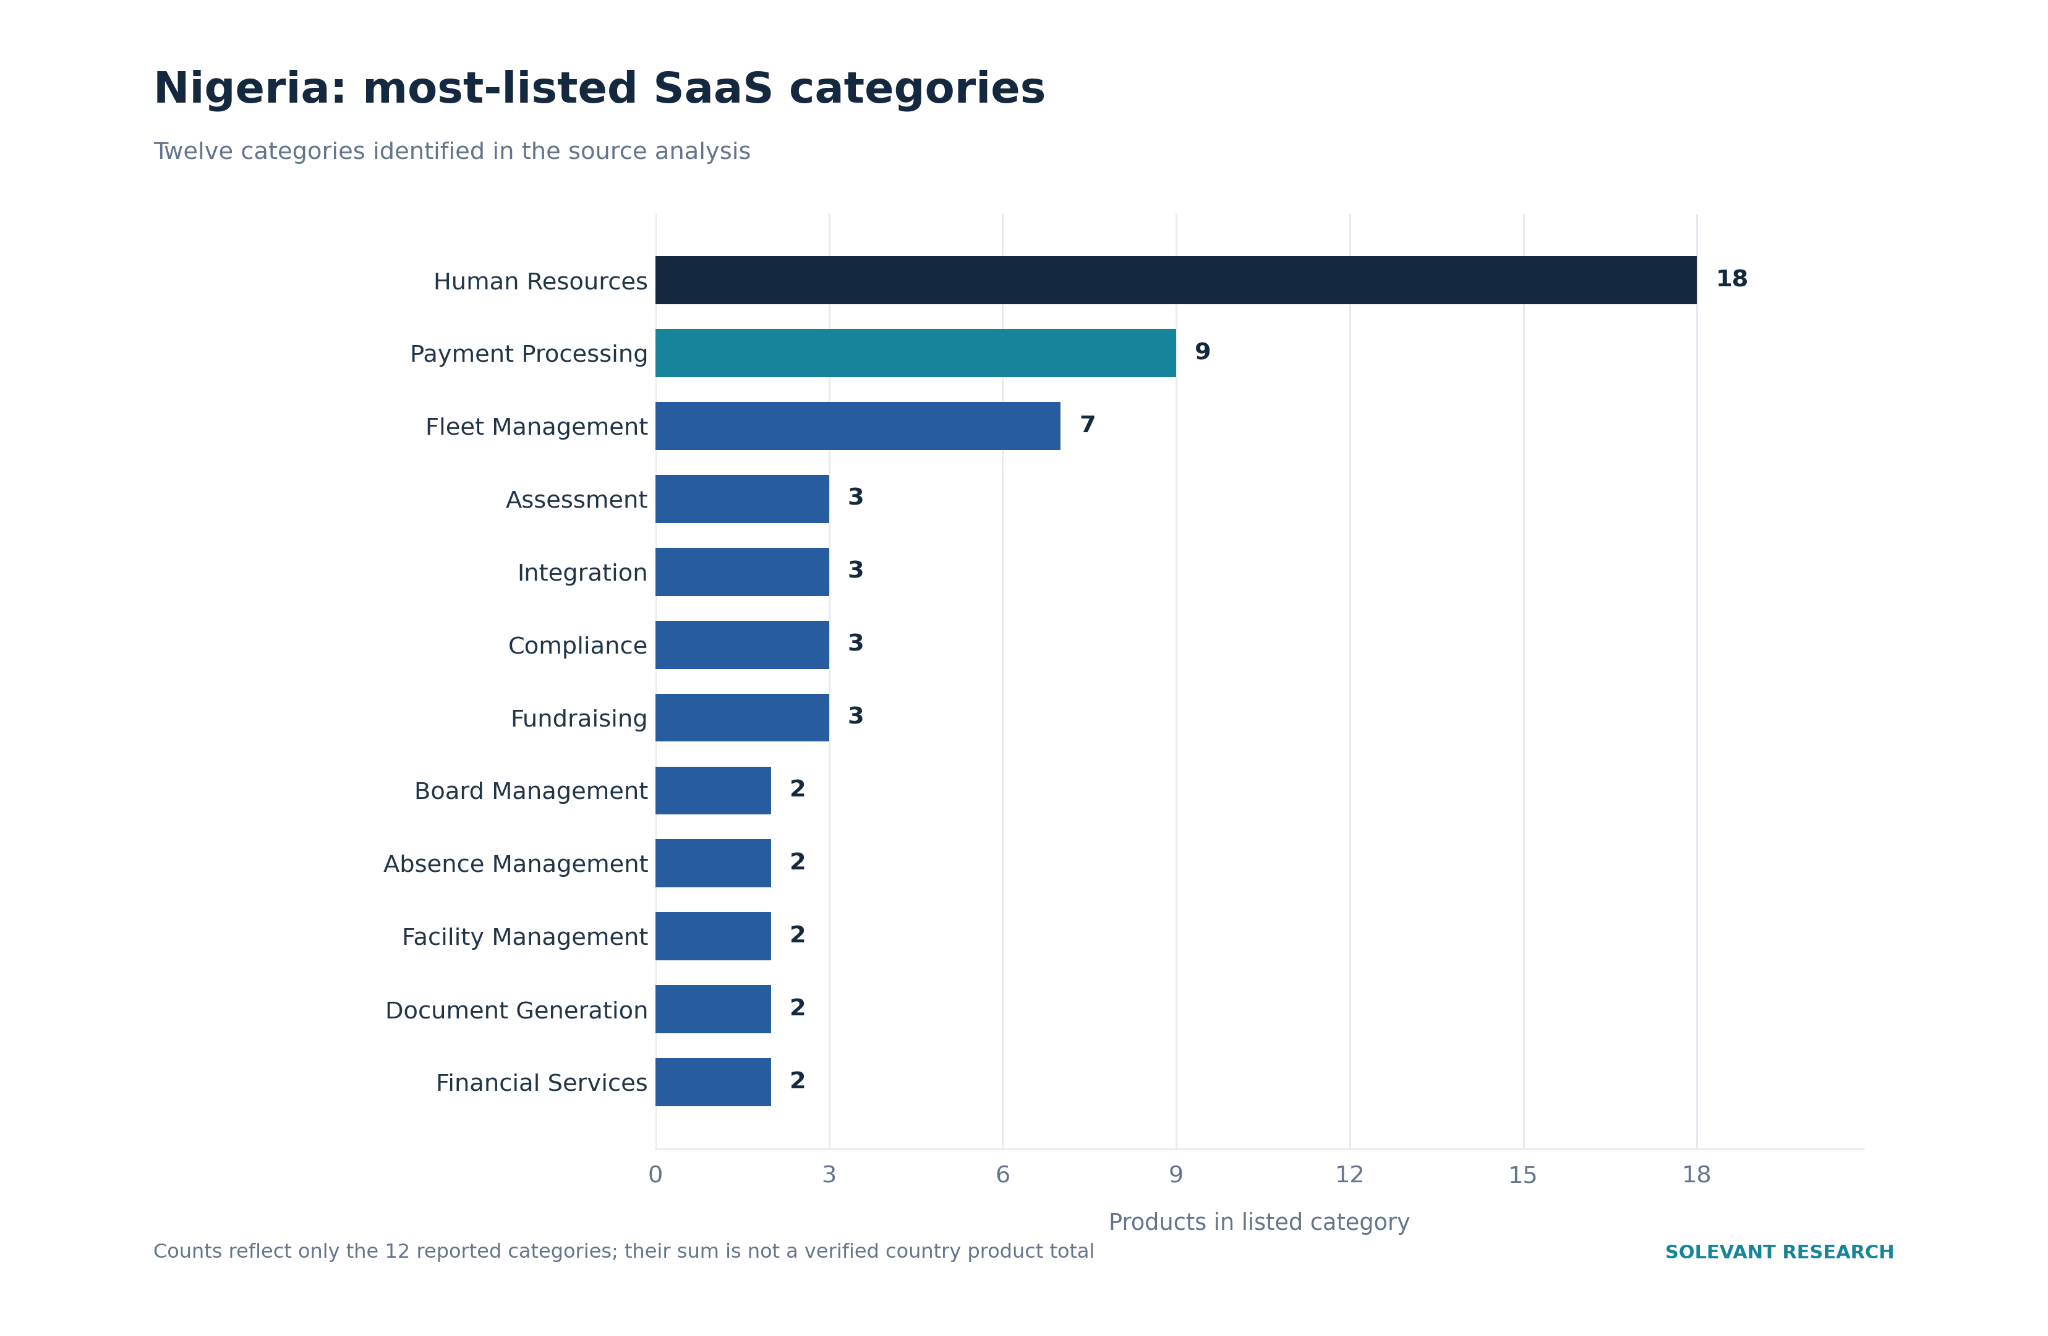
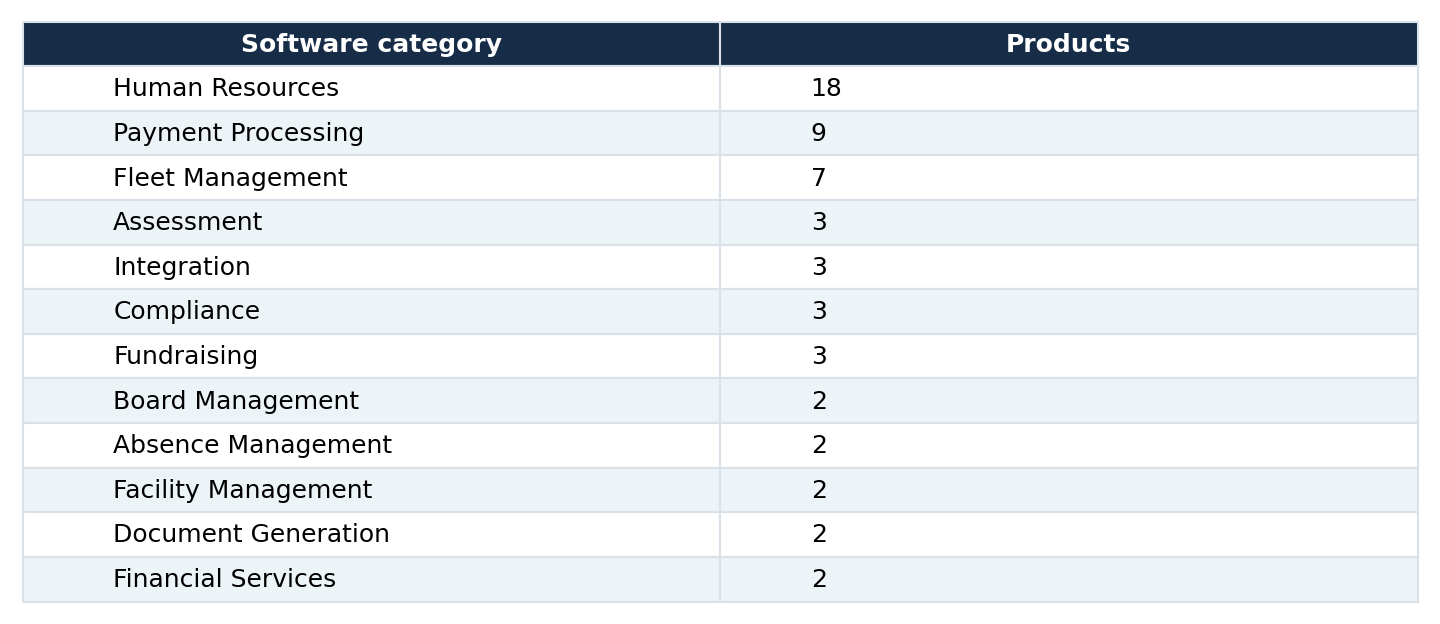
Human Resources has twice as many listings as Payment Processing in the reported categories. The presence of payment and financial software is notable, but the list also includes workforce management, fleet operations, compliance, fundraising, and document generation. This supports a narrower conclusion than saying Nigeria's entire SaaS market is dominated by fintech. The supplied figures identify the leading categories in this particular sample. They do not provide complete national category totals, adoption rates, or revenue figures. The 12 reported category counts sum to 56, but this is not a verified total for all Nigerian products in the 436-product sample.
Kenya SaaS Categories: Business Intelligence and Employee Engagement Tie
Kenya is the only country in the five-country comparison with two categories tied for first place. Business Intelligence and Employee Engagement each have six products. Several other categories have three listings each.
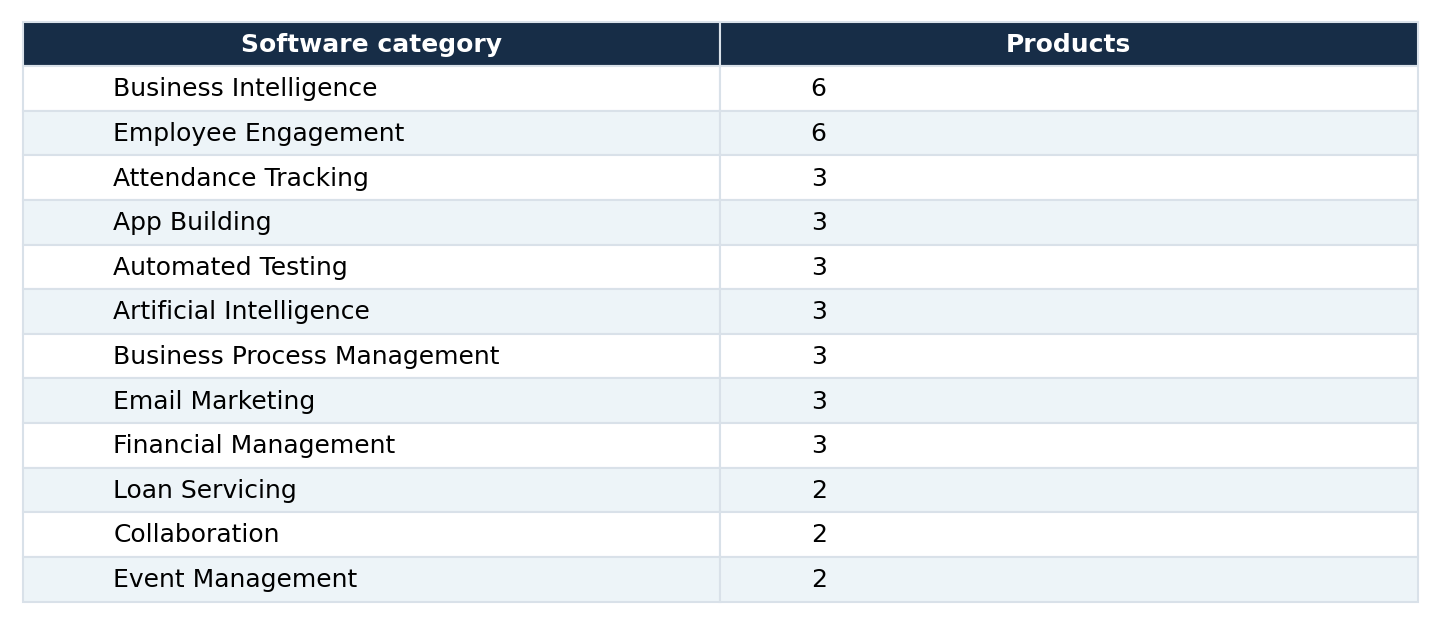
Kenya's reported categories include analytics, workforce engagement, software development, automation, marketing, and financial management. No single category has a particularly large count in the supplied list. The tie between Business Intelligence and Employee Engagement is a feature of the recorded category frequencies, not evidence that the two categories have equal revenue or customer demand.
Morocco SaaS Categories: SMS Marketing Ranks First
SMS Marketing leads Morocco's reported category list with five products. School Management follows with three. Applicant Tracking, Fitness, Inventory Management, and Warehouse Management each have two listings.
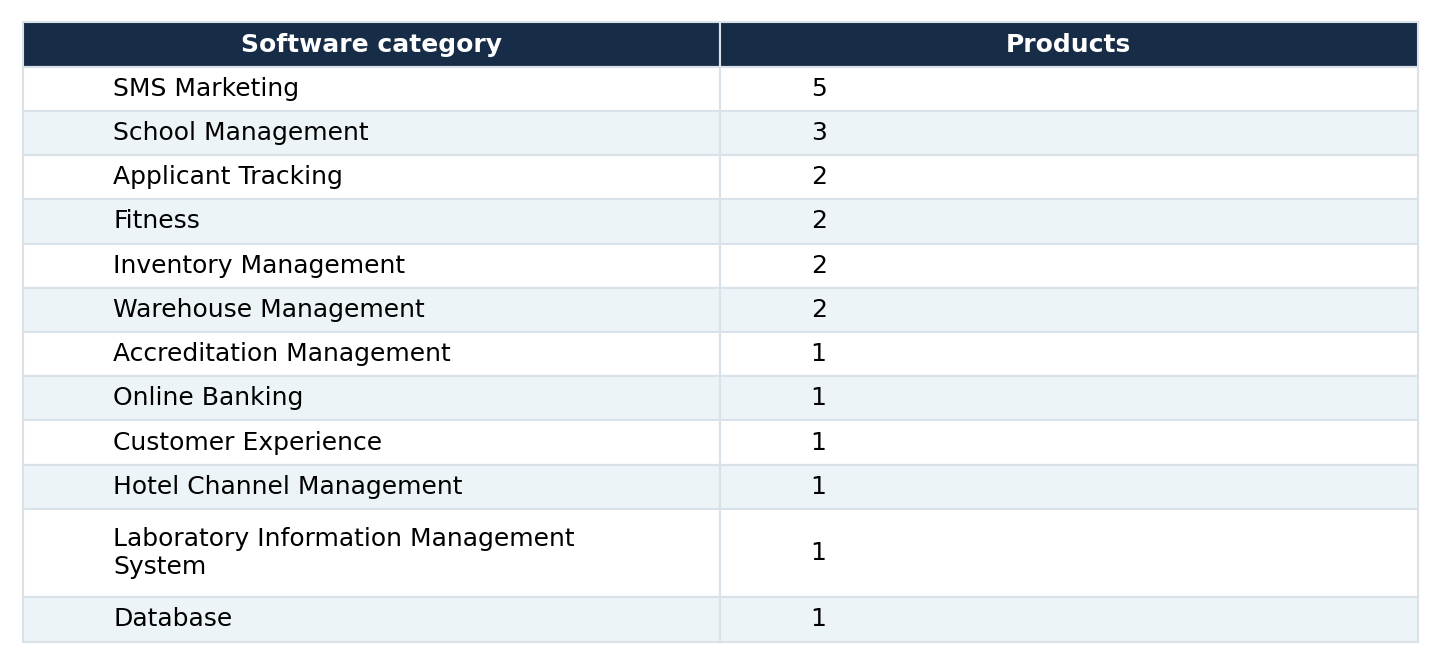
Most categories in Morocco's reported list contain only one or two products. The variety of categories is worth noting, but the small counts make broad generalizations unreliable. For example, SMS Marketing's first-place position does not establish that marketing software is Morocco's largest SaaS sector by revenue or usage.
Egypt SaaS Categories: Banking Systems Leads a Small Category List
Banking Systems ranks first in Egypt's reported category breakdown, with three products. Five categories follow with two products each: Membership Management, Medical Imaging, Point of Sale, Multi-Channel E-Commerce, and Website Builder.
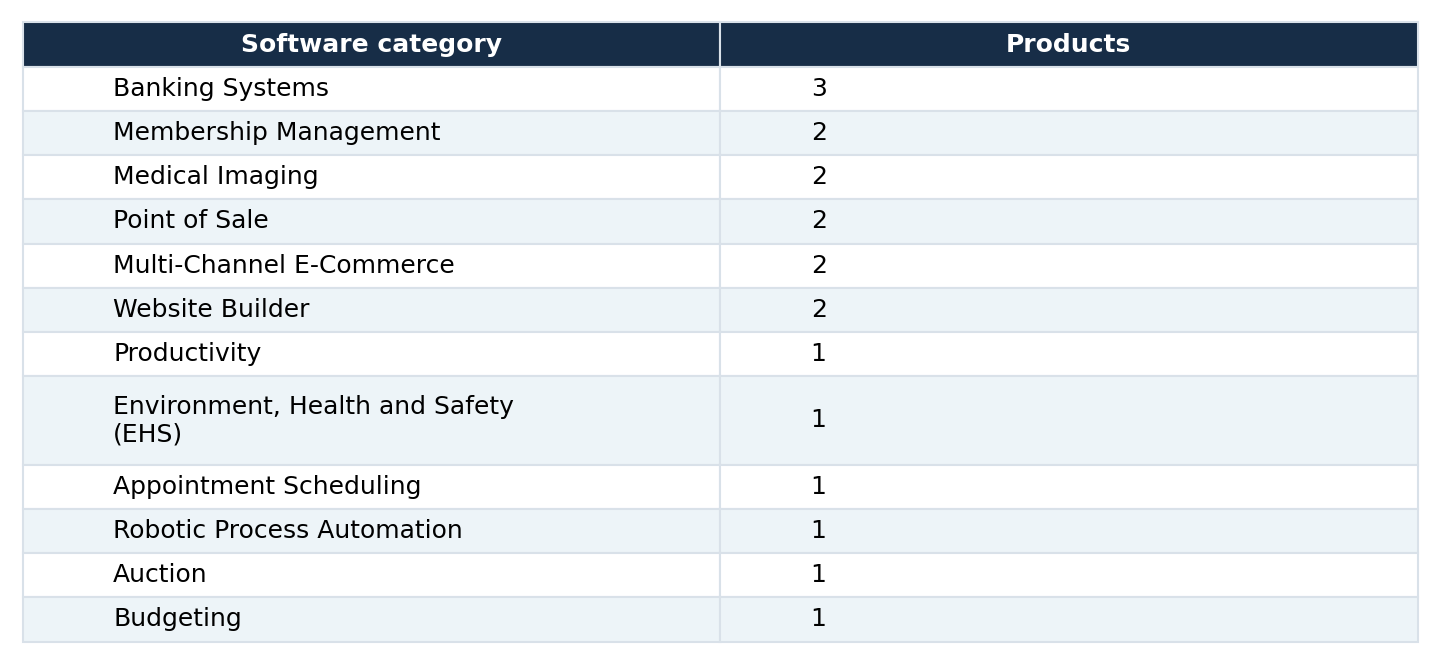
Egypt's category list spans banking, healthcare, retail, e-commerce, productivity, and business administration. However, the highest individual category count is just three. This is too small a basis for strong claims about which software industries dominate Egypt's wider SaaS economy.
How Much Do African SaaS Products Cost?
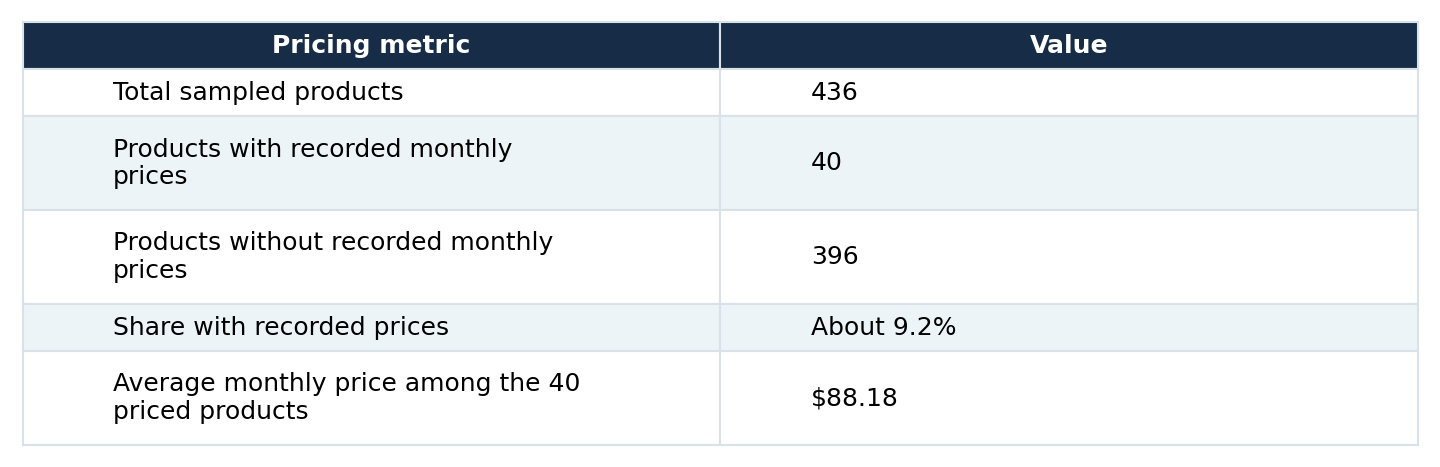
The source reports an average monthly price of $88.18, calculated from the 40 products with recorded monthly pricing. Those 40 products represent approximately 9.2% of the 436-product sample. The other 396 products have no recorded monthly price in the source.
Is $88.18 the Average SaaS Price in Africa?
No. It is the average reported for the 40 priced products in this five-country sample. It is not a verified average for all 436 sampled products, all products in the five countries, or the African SaaS market as a whole. The missing pricing data is substantial. Without knowing the prices of the remaining 396 products, the research cannot establish whether the priced subset is representative. The source also does not provide a country-by-country price table, so this article does not rank the five countries by SaaS pricing.
How Many African SaaS Products Offer Free Trials?
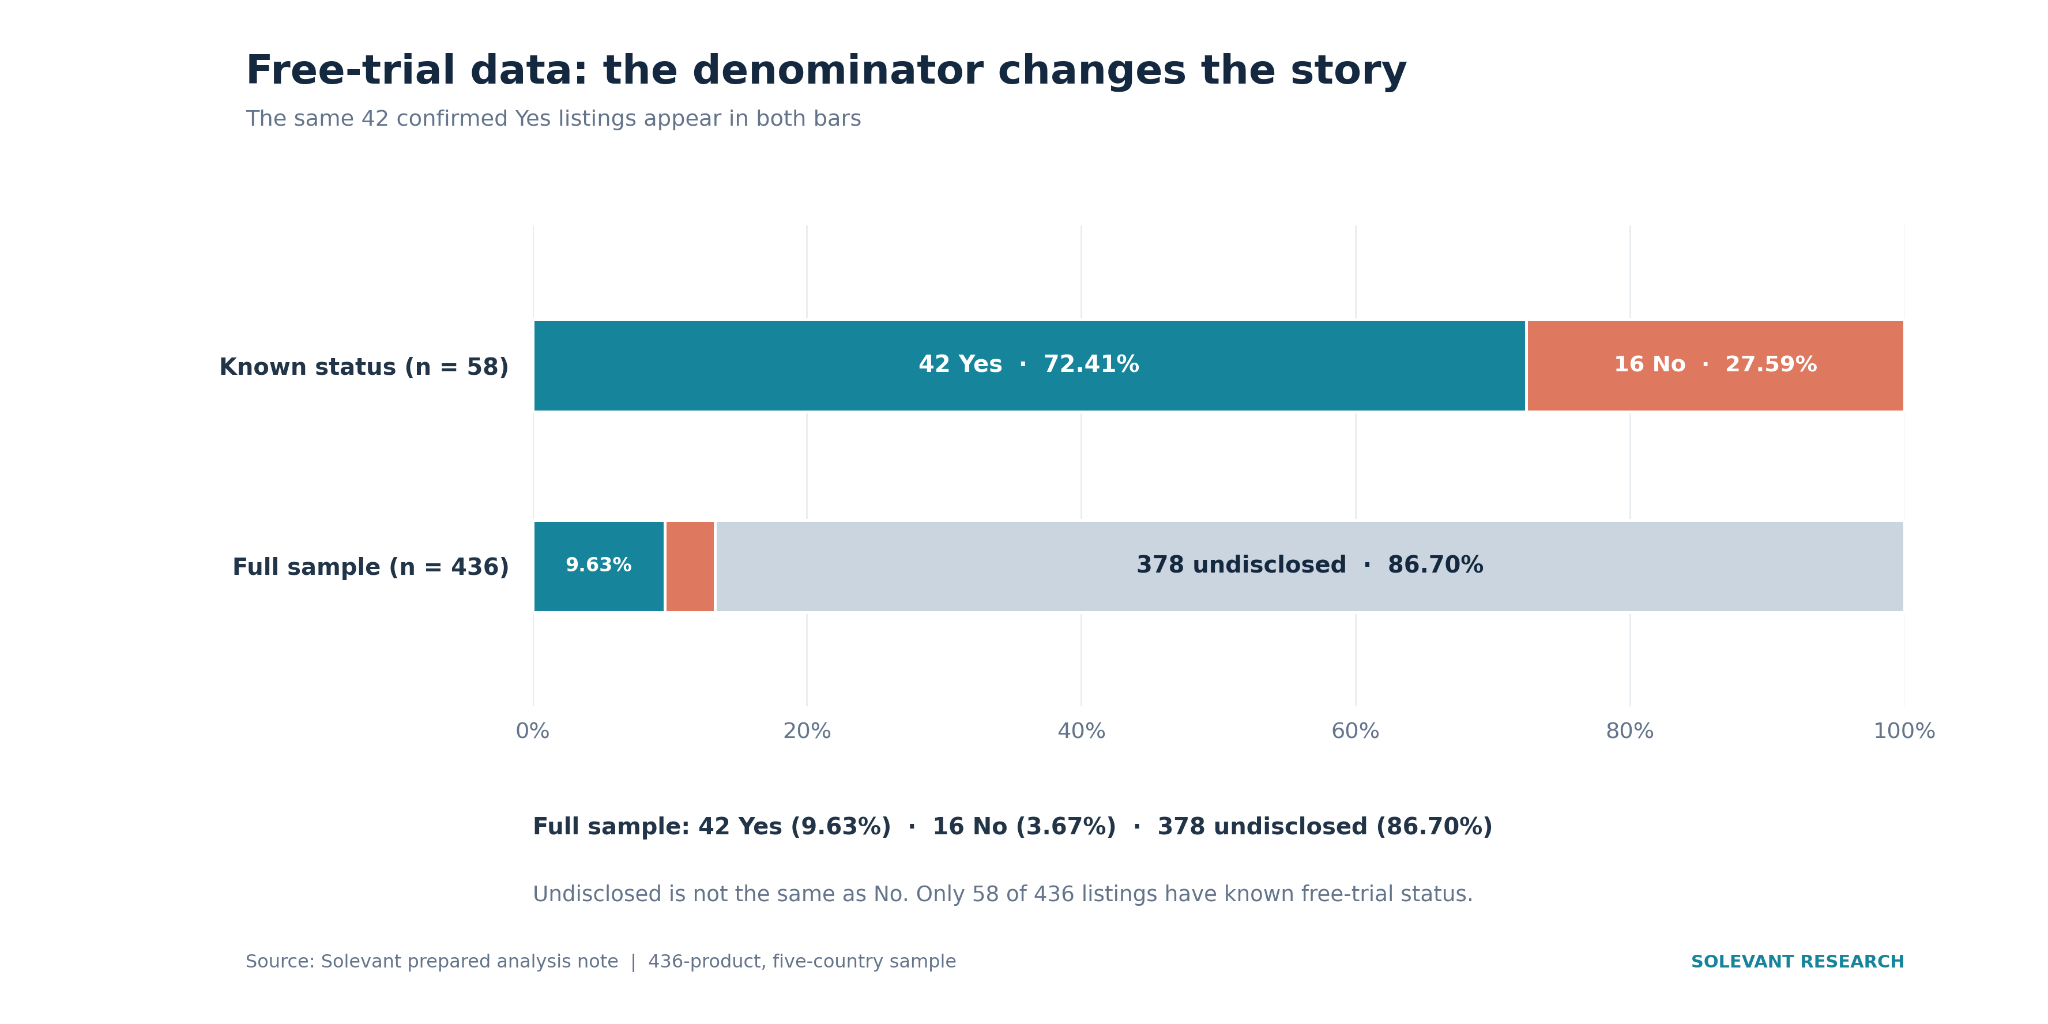
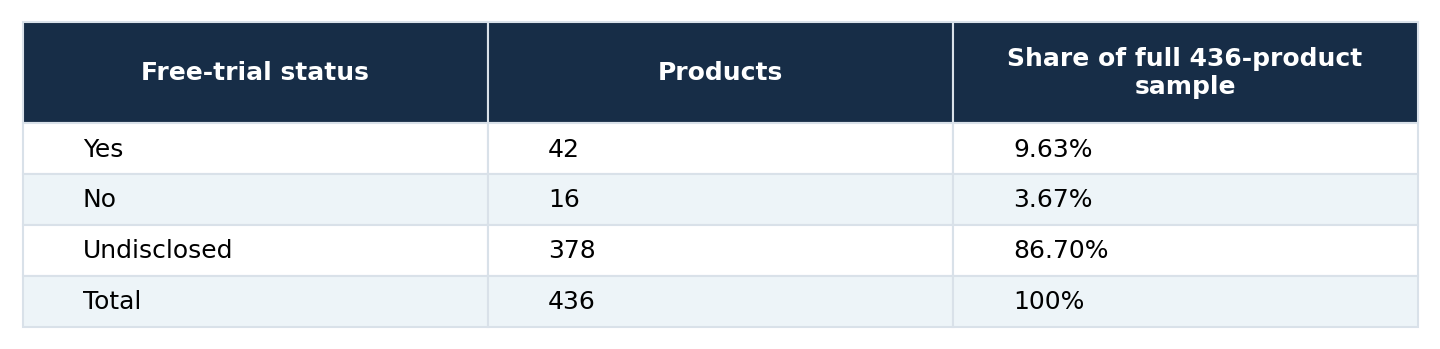
The free-trial findings are one of the most important parts of this research because they demonstrate how the denominator changes the interpretation. Free-trial status is recorded for 58 of the 436 products. Of those 58 products: 42 are marked Yes. 16 are marked No. The remaining 378 products have no recorded free-trial status.
Why Does the Report Show Both 72.41% and 9.63%?
Both percentages describe the same 42 products, but they use different denominators. Among the 58 products with known free-trial status: 42 ÷ 58 × 100 = 72.41% Across the entire 436-product sample: 42 ÷ 436 × 100 = 9.63% The first percentage tells us the proportion of products offering a free trial among those with recorded status. The second tells us the proportion of the full sample confirmed as offering a free trial. Neither figure establishes the true free-trial adoption rate across all 436 products, because the status of 378 products is unknown.
Does Missing Free-Trial Information Mean No Free Trial Is Available?
No. An undisclosed free-trial field is not the same as a confirmed No. Some products with missing information may offer trials, while others may not. The dataset does not tell us which. For software buyers and researchers, this distinction is essential: missing information should be reported as missing, not silently classified as a negative response.
When Were the Sampled African SaaS Products Launched?
Launch-year information is available for 234 of the 436 products, representing approximately 53.7% of the sample. The other 202 products have no recorded launch year. The prepared analysis provides exact launch counts for six specific years.
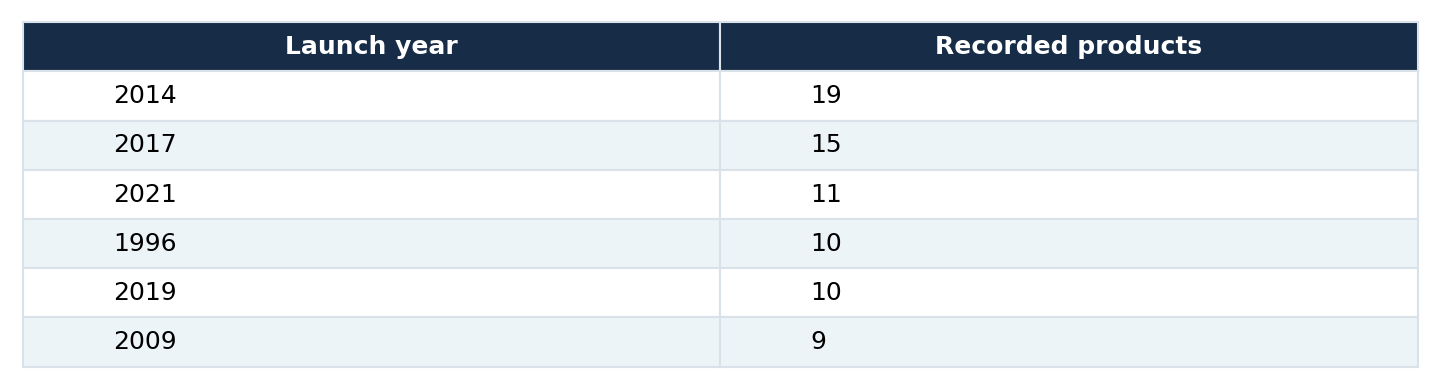
Among the years with individually reported counts, 2014 has the highest figure, with 19 products. The source also describes 2012, 2013, 2016, and 2018 as having approximately 11–12 launches each, without specifying the exact count for each year. Those years are therefore not assigned invented values or included in a complete annual trend chart.
Did African SaaS Product Launches Peak in 2014?
The source supports only a limited conclusion. 2014 has the highest exact launch count among the years individually quantified in the prepared analysis. It does not establish that all African SaaS product launches peaked in 2014. A full year-by-year dataset would be needed to identify an overall peak reliably. The missing launch years and absence of a reporting period further limit historical interpretation.
What Do the Five Country Comparisons Reveal?
The category lists reveal different recorded leaders across the five countries. South Africa's list is headed by ERP, Nigeria's by Human Resources, Kenya's by Business Intelligence and Employee Engagement, Morocco's by SMS Marketing, and Egypt's by Banking Systems. But the findings should not be stretched into unsupported conclusions about national market maturity. The source note includes qualitative classifications such as “High maturity,” “Growing & dynamic,” “Emerging,” and “Balanced,” but does not provide numerical criteria for assigning those labels.
Consequently, this analysis does not treat those classifications as independently verified rankings. The stronger finding is that different software categories lead the five reported country lists, while the limited coverage prevents reliable comparisons of their total SaaS market sizes.
Methodology and Data Limitations
This article is based on Solevant's African SaaS Categories, Pricing and Trial Data by Country report. The report draws from a prepared analysis note covering 436 sampled SaaS products in South Africa, Nigeria, Kenya, Morocco, and Egypt. The underlying product-level records were not available for independent verification. The figures have therefore been taken from the source note's published tables and statements rather than independently recalculated from raw product records.
Data coverage
Important limitations
The report does not specify a collection date, reporting period, or update frequency. It covers five countries, not the entire African continent. The country category tables show selected leading categories, not complete country product totals. The report does not provide country-level denominators for calculating category market shares. Monthly pricing is recorded for only 40 products. Free-trial status is unknown for 378 products. Launch years are missing for 202 products. The launch-year note does not provide exact counts for every year.
Vendor rankings and market-maturity classifications cannot be independently verified from the supplied numerical tables. The source reports 40 out of 436 as 9.18%; recalculating that fraction gives 9.17% to two decimal places. This article uses approximately 9.2% and retains the underlying counts.
How Does This Report Differ From Solevant's Other African SaaS Research?
A separate Solevant report, African SaaS Market by Country, examines 1,803 products across 45 countries. The present report uses a different 436-product, five-country sample. The two datasets should not be combined or treated as directly comparable populations without additional evidence about their selection and overlap.
Frequently Asked Questions
How many SaaS products does this African category report cover?
The report covers 436 sampled SaaS products across South Africa, Nigeria, Kenya, Morocco, and Egypt.
Which SaaS category leads in South Africa?
Enterprise Resource Planning leads the reported South African category list with 22 products, followed by Billing and Invoicing with 12.
What is the most common SaaS category in Nigeria?
Human Resources leads Nigeria's reported category list with 18 products, followed by Payment Processing with nine and Fleet Management with seven.
Which categories lead in Kenya?
Business Intelligence and Employee Engagement are tied, with six products each.
Which SaaS categories lead in Morocco and Egypt?
SMS Marketing leads Morocco's reported list with five products, while Banking Systems leads Egypt's with three.
What is the average monthly price of the sampled African SaaS products?
The source reports $88.18 among the 40 products with recorded monthly prices. This is not an average for the full 436-product sample.
What percentage of products offer a free trial?
Among the 58 products with recorded free-trial status, 72.41% are marked Yes. Across the entire 436-product sample, only 9.63% are confirmed Yes, while 378 products have undisclosed status.
How many products have a recorded launch year?
Launch years are available for 234 of the 436 products, approximately 53.7%.
Which year had the most recorded SaaS launches?
Among the years with exact counts in the source note, 2014 leads with 19 products, followed by 2017 with 15.
Does the report cover every African country?
No. It covers five countries and should not be treated as a complete survey of the African SaaS market.
Conclusion
Solevant's African SaaS category research highlights differences in the leading software categories recorded across five African countries. ERP leads South Africa's reported list, Human Resources leads Nigeria's, Business Intelligence and Employee Engagement tie in Kenya, SMS Marketing leads Morocco's, and Banking Systems leads Egypt's. Only about 9.2% of sampled products have recorded monthly prices, while free-trial status is known for just 13.3%. The difference between 72.41% offering a trial among known-status products and 9.63% confirmed across the full sample is a particularly important example of how a statistic can change depending on its denominator.
Ultimately, this research offers a useful snapshot of software categories and product information in five African markets. Its greatest value comes from presenting the recorded findings clearly while acknowledging what the available data cannot establish.