Solevant insights
Practical software insights, guides, and ideas for better business decisions.
Explore market-cap concentration across 3,965 token records, including Bitcoin’s share and stablecoins, using an undated research snapshot rather than live prices.
Compare 131 US events with a 614-event global index, including format records, topic rankings and the limits of a single September 2026 snapshot.
Explore recorded SaaS integrations by launch year from 2005 to 2025, with cohort comparisons, category differences and listed-price patterns.
Compare US, UK and Canada clinical trial records with Solevant’s full graph, covering study types, status differences and sponsor rankings.
Explore company records, classifications and date patterns for Germany, Ghana and Australia, with clear distinctions between index coverage and national business counts.
Compare 594 tracked exchange identifiers across five countries, including recorded statuses, JSE-associated entries and the limits of directory counts.
Compare leading SaaS categories across five African countries, with pricing, free-trial and launch-year findings from a 436-product sample.
Explore how 263 software categories declare the industries they serve, including the four labels that dominate recorded product-industry mentions.
See how 12 keywords appear across 101,827 SaaS product names and compare their recorded prices, integrations and active-status shares.
Compare recorded integrations across 978 software categories and examine their relationship with average listed prices.
Compare quote-required pricing, published monthly prices and free-trial availability across software categories, with clear sample limits.
Explore social platform links across 101,868 SaaS listings, including differences by category, company size, pricing data and country.
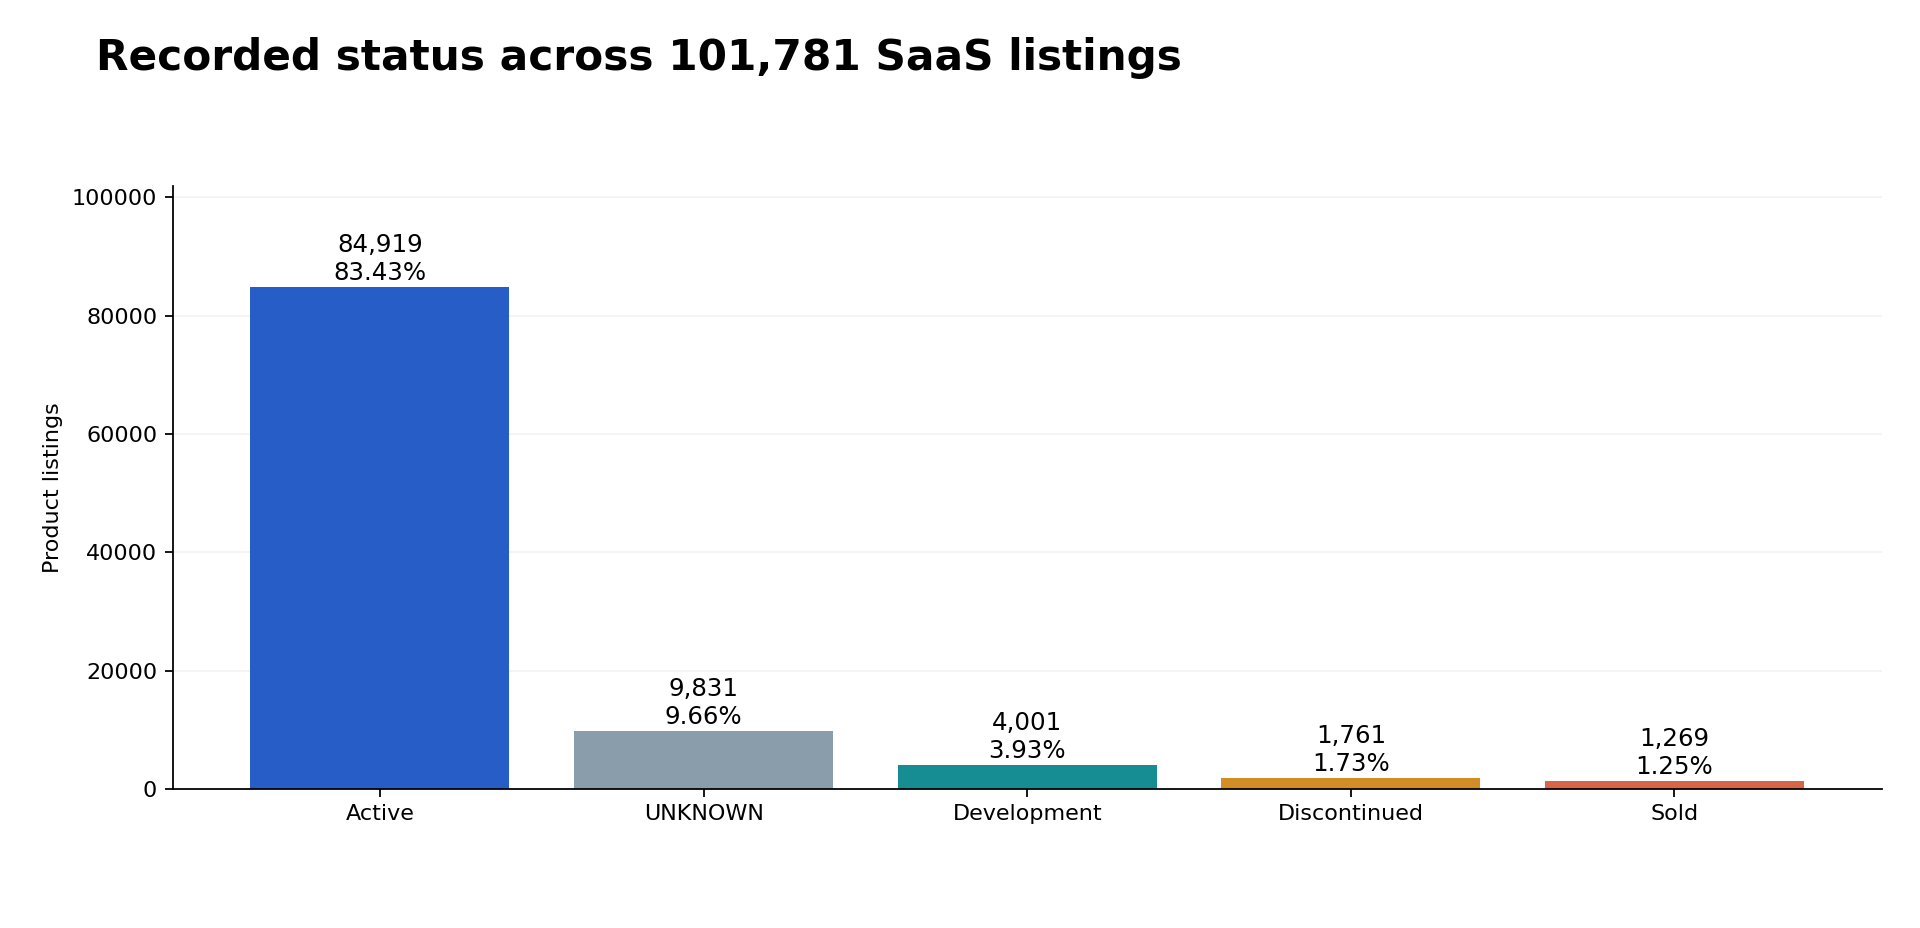
Compare lifecycle-status labels and recorded monthly prices across 101,781 SaaS product listings.
Compare freemium availability across SaaS categories and countries, and examine its relationship with pricing, category size and industry coverage.
Explore the industries SaaS products serve and how average product age differs across software categories in Solevant’s catalog.
Examine SaaS language support beyond English, comparing regional coverage, software categories, pricing patterns and catalog data-quality gaps.
Discover where 355 new SaaS products entered in 2023, with category rankings and analysis of pricing, competition and AI-focused product activity.
Compare cloud and on-premise deployment across 101,868 software listings, including hybrid availability, category differences and pricing patterns.
Explore 428 SaaS products from 381 Nigerian vendors, including leading categories, fintech representation, integrations and pricing visibility.
Explore 3,673 Asian SaaS listings, comparing leading countries, software categories, published pricing and recorded product launch trends.
Compare iOS and Android availability, software categories and pricing across 101,868 SaaS listings, with key gaps in mobile deployment data.
Explore 1,803 SaaS products across 45 African countries, comparing product counts, published pricing and software integrations in Solevant’s catalog.