
SaaS Language Coverage: English, Europe and Beyond
How multilingual is the SaaS software market? English dominates language support in Solevant's software catalog. After cleaning duplicate language labels, 94,154 products declare English support, equivalent to 92.42% of the stated 101,875-product catalog. But the picture changes beyond English. French, Spanish, German, Italian and Portuguese each appear in more than 60% of the catalog. Japanese, Chinese, Dutch and Russian fall closer to 40%–47%, while several African languages have much smaller recorded product counts.
The research also uncovers substantial differences in average software pricing by language and a significant data-quality problem: not every entry in the catalog's language field is actually a language. This article examines which languages SaaS products support, how language coverage varies across software categories, and what the pricing data can—and cannot—tell us.
Key Findings
- English is supported by 94,154 products, representing 92.42% of the stated catalog.
- French, Spanish, German, Italian and Portuguese each have coverage between 60% and 72%.
- Dutch coverage is 40.89%, considerably below the five-language European group.
- Japanese reaches 47.04%, Chinese 43.22%, Russian 40.53% and Korean 31.20%.
- The source contains 999 raw language rows, but 161 contain non-language values.
- Another 88 language labels appear in duplicate forms that need to be merged.
- English-language Payment Processing listings have a recorded average price of $5,674, compared with $70.78 across French, Spanish and German averages.
- Learning Management System, Project Management and CRM frequently rank among the largest categories across the 12 languages examined in the pricing dataset.
- Hausa, Yoruba and Igbo together account for 167 recorded product declarations.
Which Languages Do SaaS Products Support Most Often?
English has by far the broadest declared coverage in Solevant's catalog. The cleaned dataset records 94,154 products supporting English, equivalent to 92.42% of the stated catalog. French ranks second at 71.71%, followed by Spanish at 71.24% and German at 69.85%.
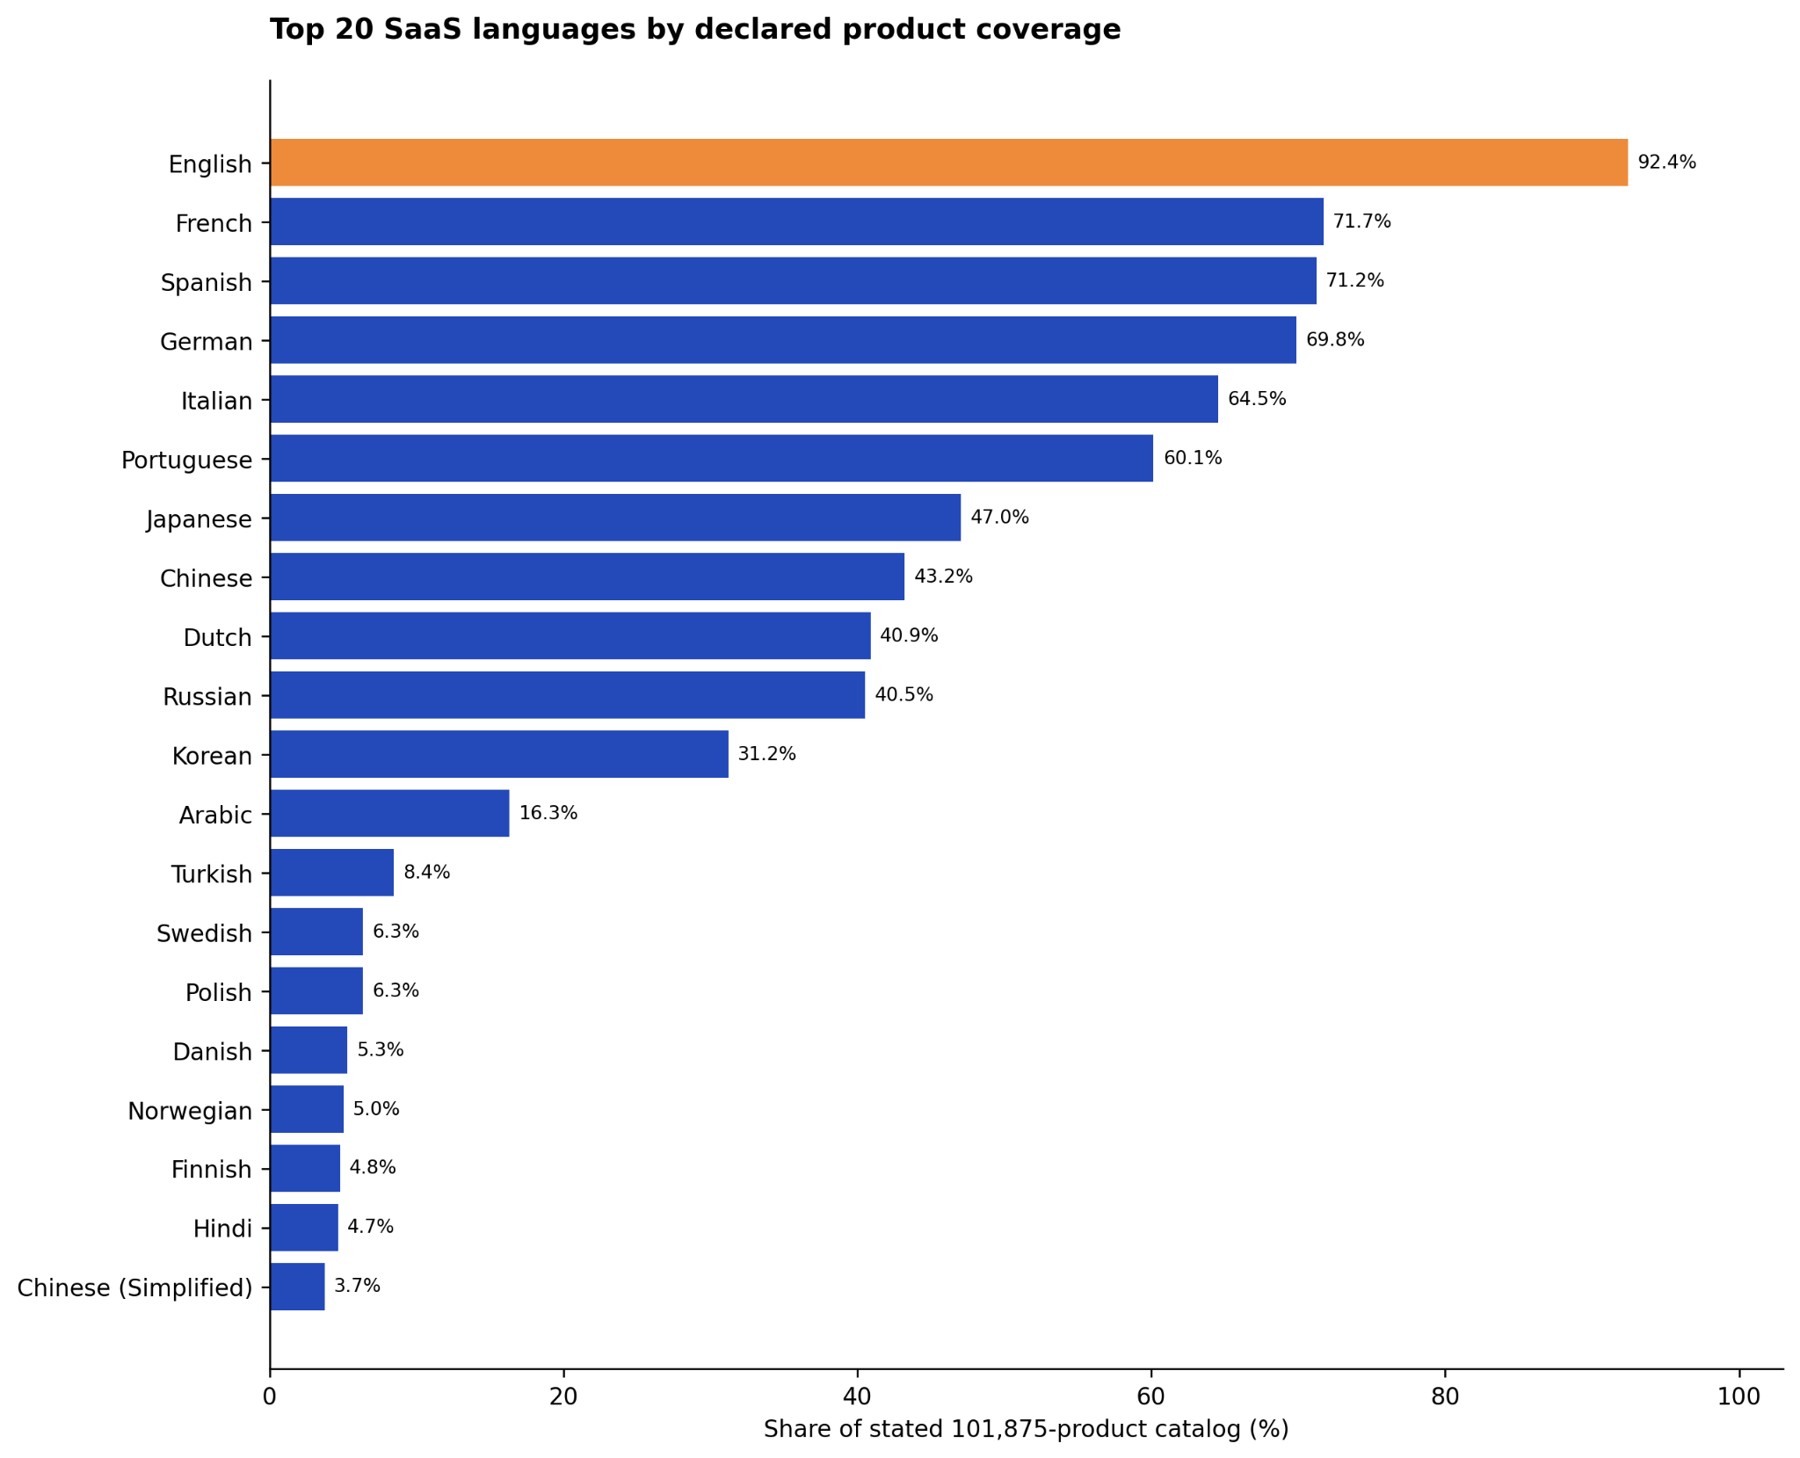
The leading languages include:
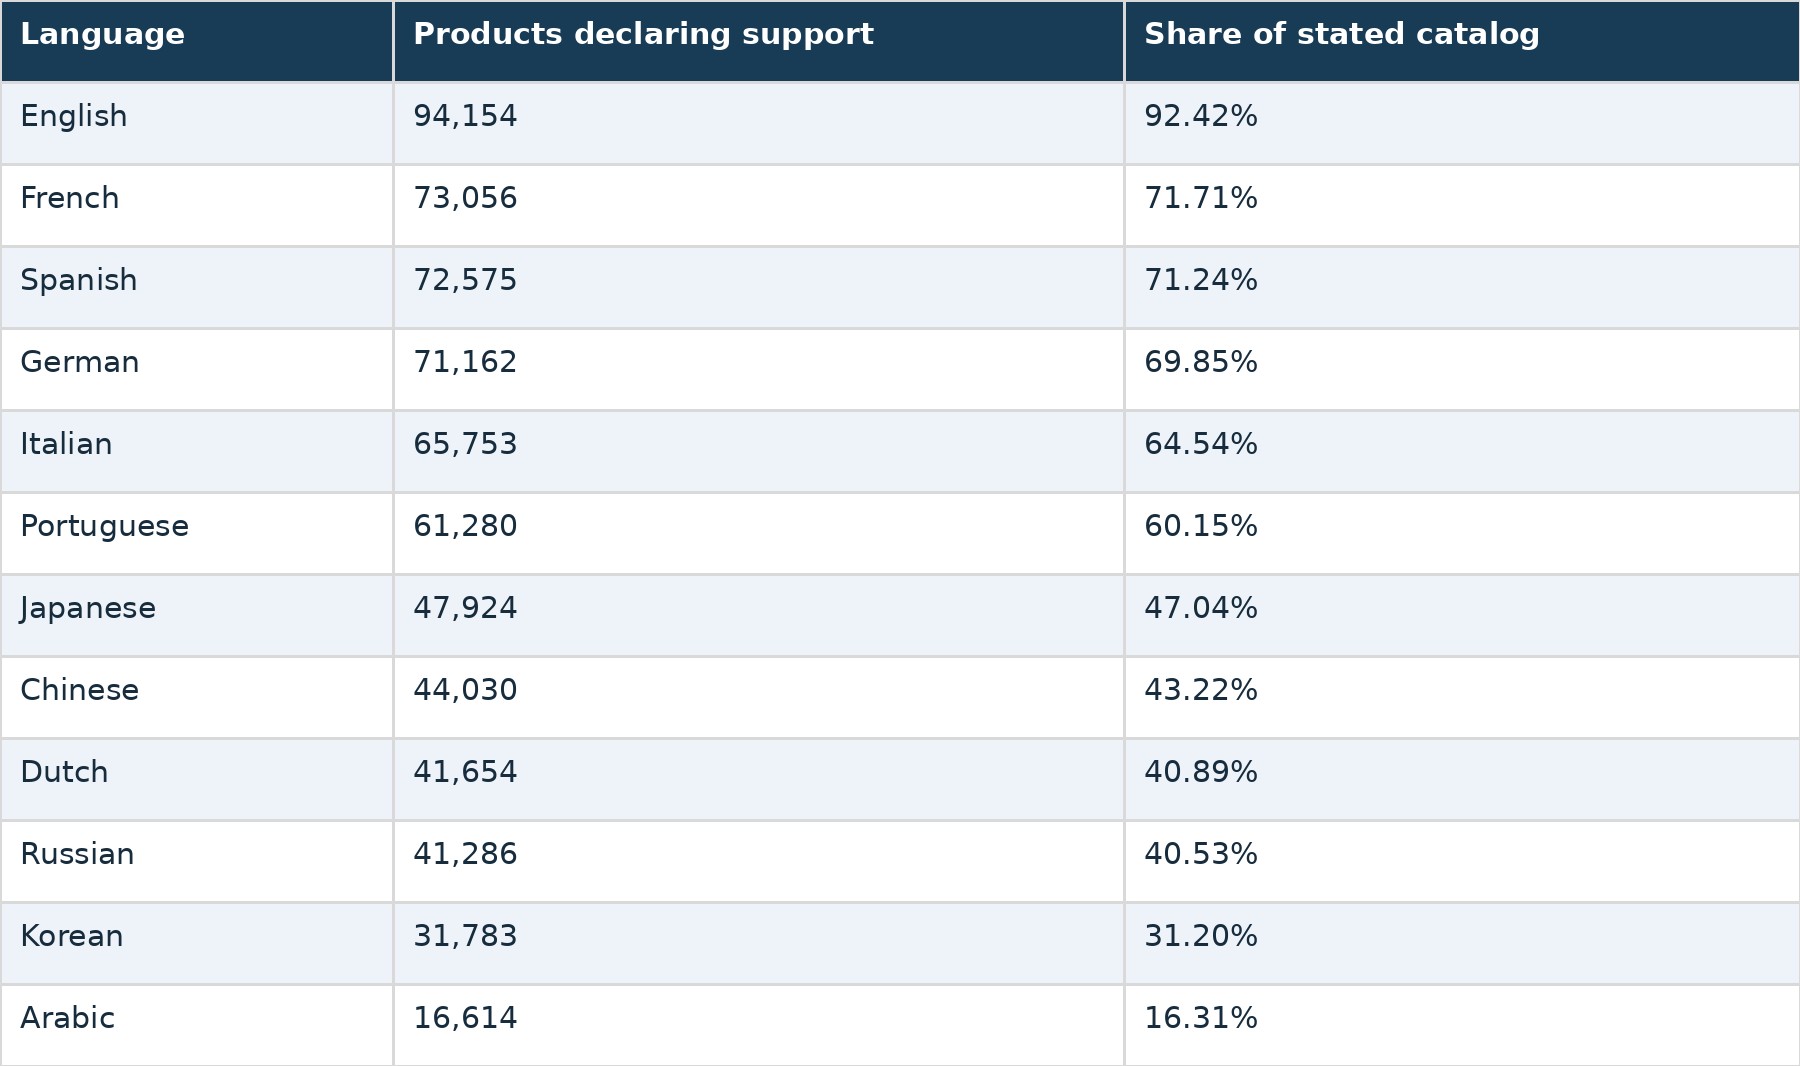
These percentages are not expected to add up to 100%. A single SaaS product may support multiple languages and therefore contribute to several language counts. The results measure declared product language support, not the number of customers using each language or the quality of a product's translation.
How Does SaaS Language Coverage Compare Across Europe?
Five widely used European languages form a relatively close group in the dataset. French has 71.71% coverage, Spanish 71.24%, German 69.85%, Italian 64.54%, and Portuguese 60.15%. The difference between the highest and lowest of these five languages is approximately 11.6 percentage points. Dutch, however, falls outside this group. At 40.89%, Dutch is closer to Chinese (43.22%) and Russian (40.53%) than to Portuguese.
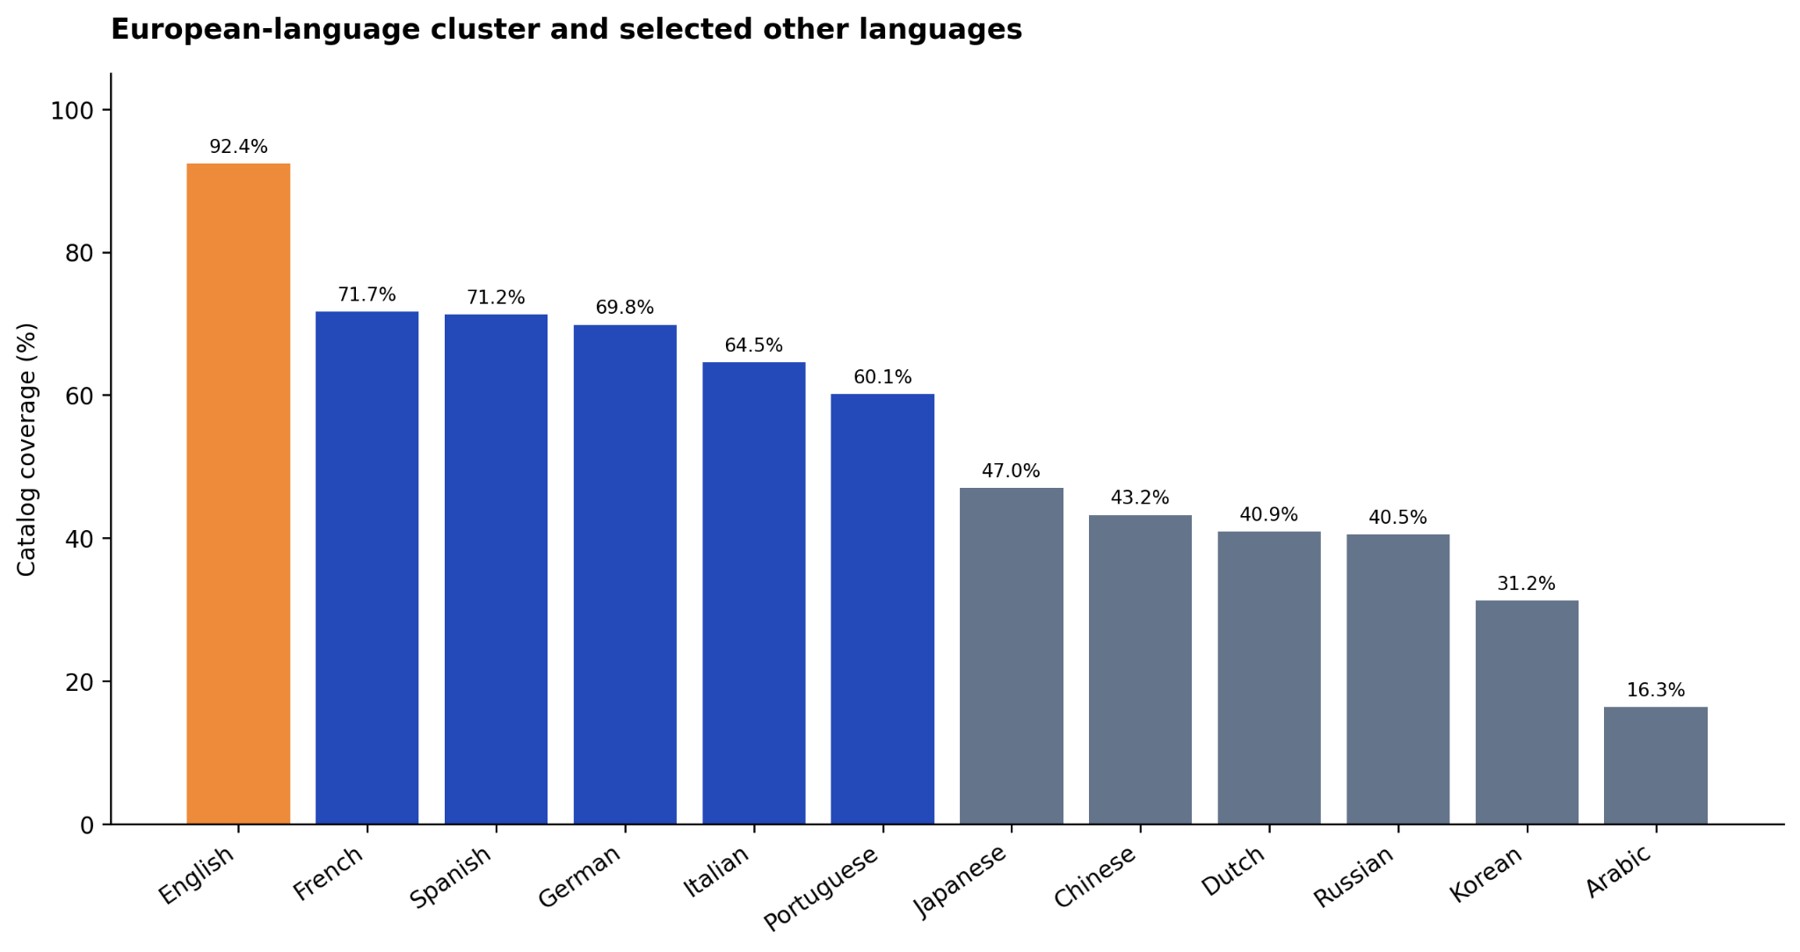
This distinction matters when discussing multilingual software availability. Grouping all major Western European languages together can conceal substantial differences in catalog coverage. The dataset also includes Swedish (6.35%), Polish (6.32%), Danish (5.30%), Norwegian (5.05%) and Finnish (4.79%). These are product-support percentages within the stated catalog, not measures of language use among European businesses.
How Much SaaS Software Supports Asian and Middle Eastern Languages?
Japanese is the highest-ranked East Asian language in the cleaned top-language list, with 47,924 product declarations, or 47.04% of the stated catalog. Chinese follows at 43.22%, while Korean reaches 31.20%. Arabic appears in 16,614 product declarations, equivalent to 16.31%. Hindi is recorded for 4,745 products, or 4.66%. These differences show that support is not evenly distributed across major languages outside the European group. However, the data does not establish where those products are sold, which countries their customers come from, or whether every declared language receives complete localization across the product interface, documentation and support.
What Does the Dataset Show About African Language Coverage?
Recorded product support for several African languages is small relative to English and the leading European languages. Swahili has 260 product declarations after duplicate labels are merged. The three Nigerian languages highlighted in the report—Hausa, Yoruba and Igbo—have 167 product declarations combined. These figures describe catalog listings that declare language support. They do not measure the number of speakers, potential customers, or the economic demand for localized software. The source does not contain reliable speaker-population figures, so a per-capita comparison between languages would require additional external data.
Does SaaS Pricing Differ by Language?
The report's second dataset examines software product counts and average prices across language-category combinations. It contains 1,000 records covering 12 languages with pricing information. One category stands out: Payment Processing. The average recorded price for English-language Payment Processing products is $5,674. Every other language in the comparison has an average below $90.
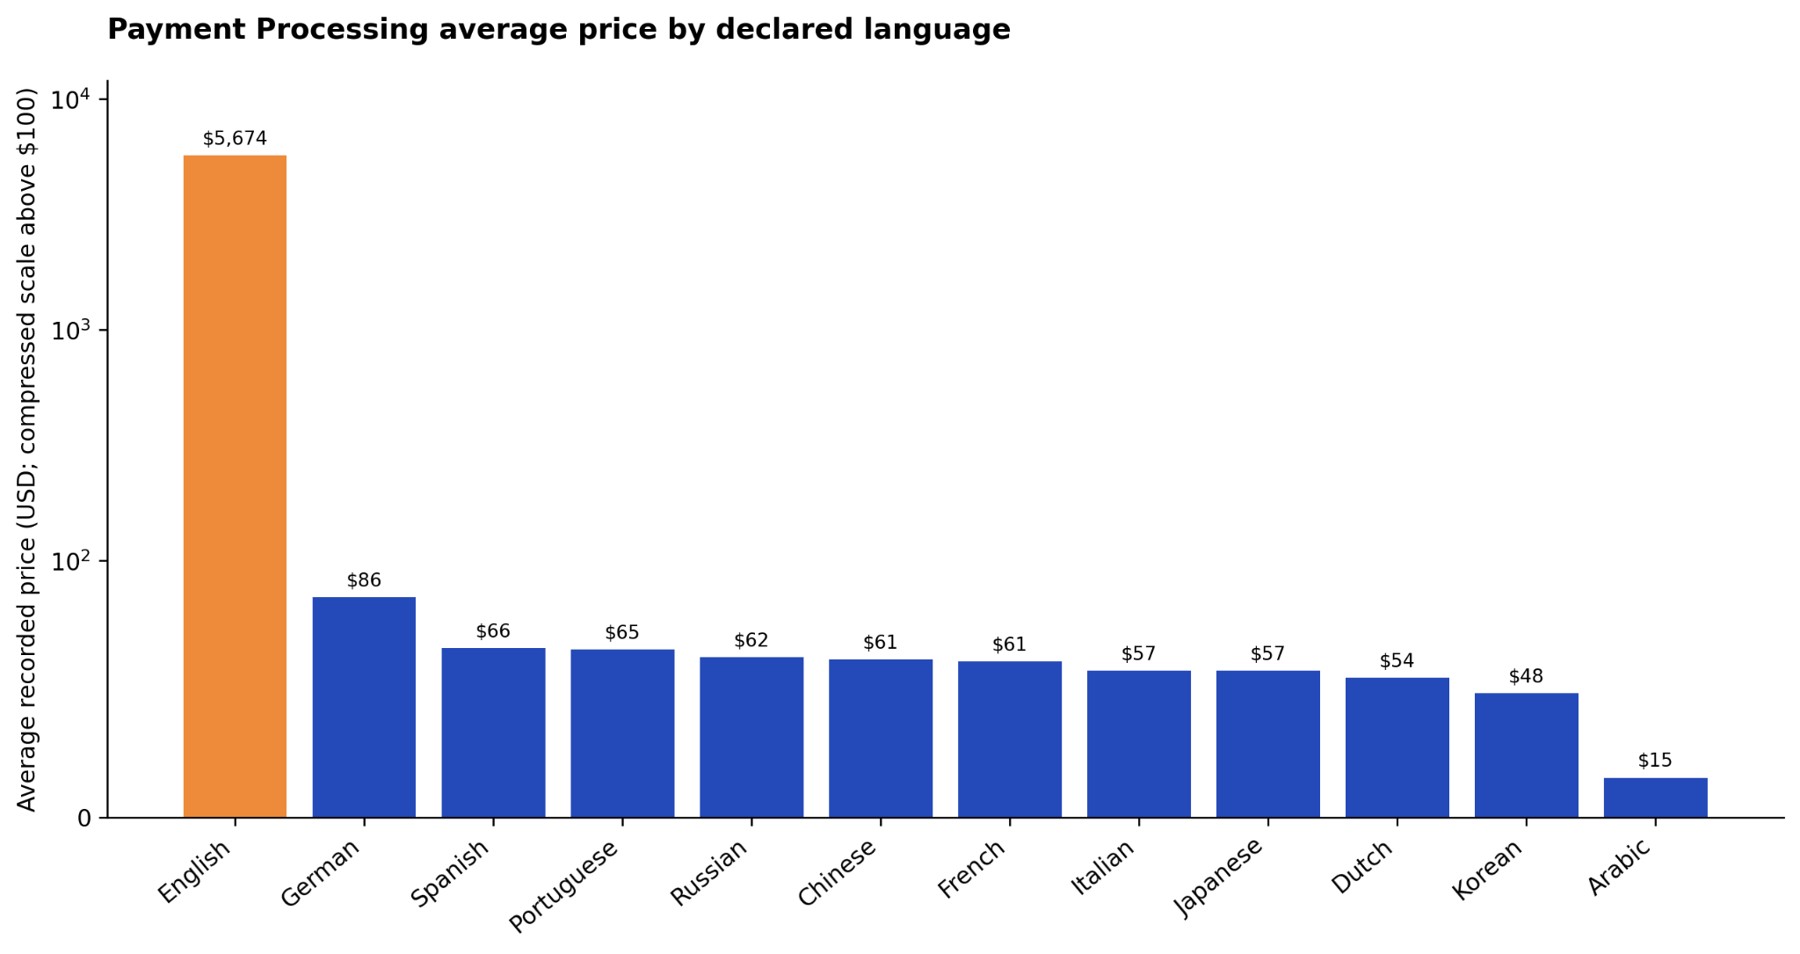
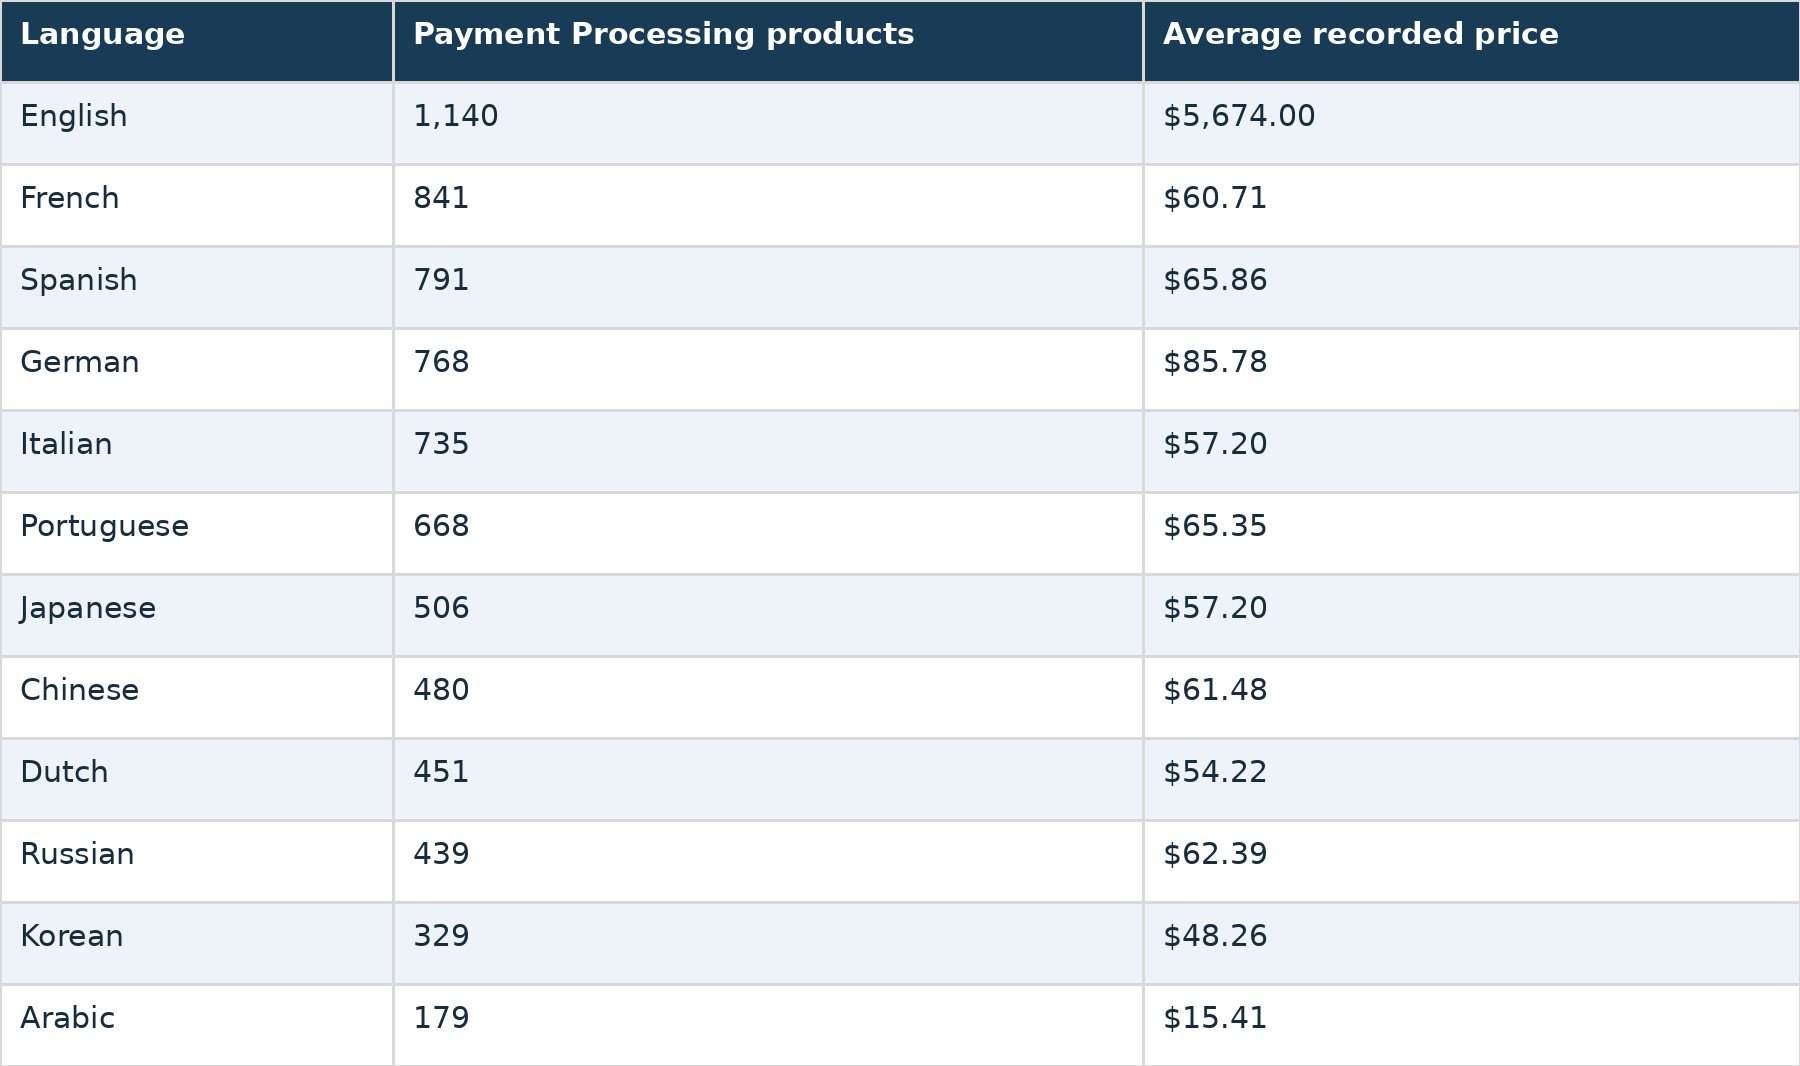
The English average is approximately 66 times the German average, the next-highest language in this category. Compared with the average of the French, Spanish and German category averages ($70.78), the English figure is approximately 80.2 times higher. This is a substantial difference, but it needs careful interpretation.
The dataset does not show matched prices for identical products in different languages. It compares averages across groups of products that declare particular language support. Consequently, the difference should not be interpreted as proof that software vendors charge English-speaking customers 80 times more. Product mix, outliers, pricing units and other unmeasured factors could affect the averages.
Which Software Categories Have the Largest English-Language Price Gaps?
The report identifies ten categories in which the English-language average price exceeds the average of French, Spanish and German.
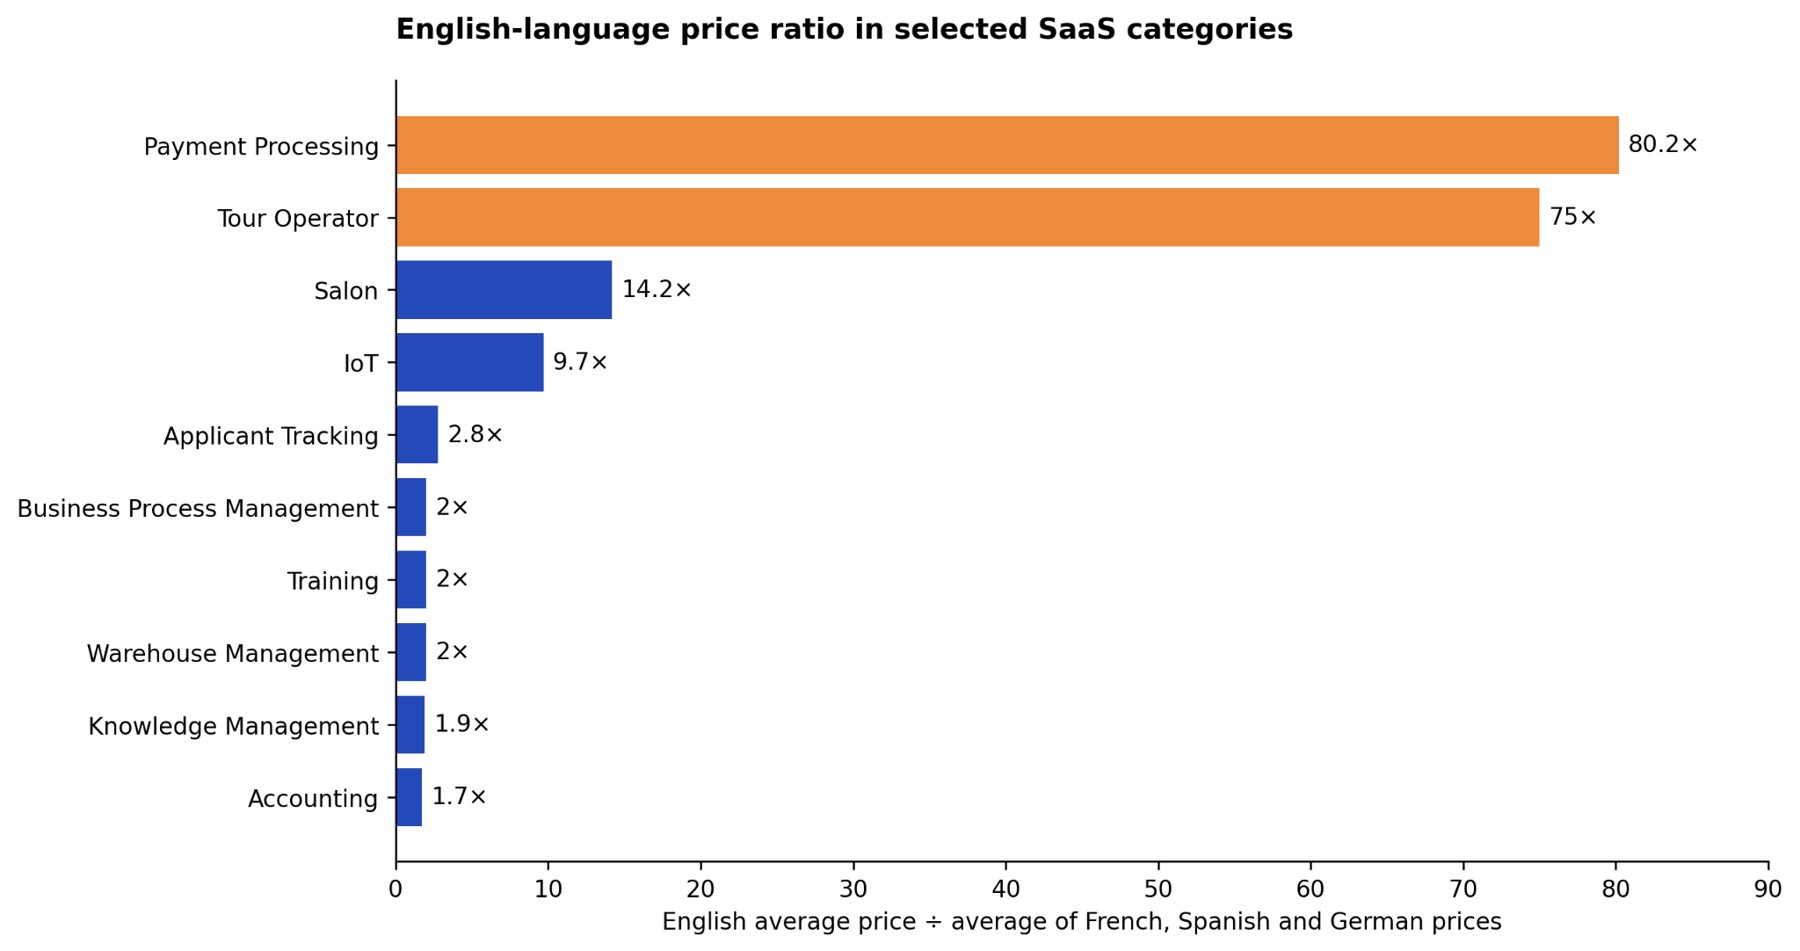
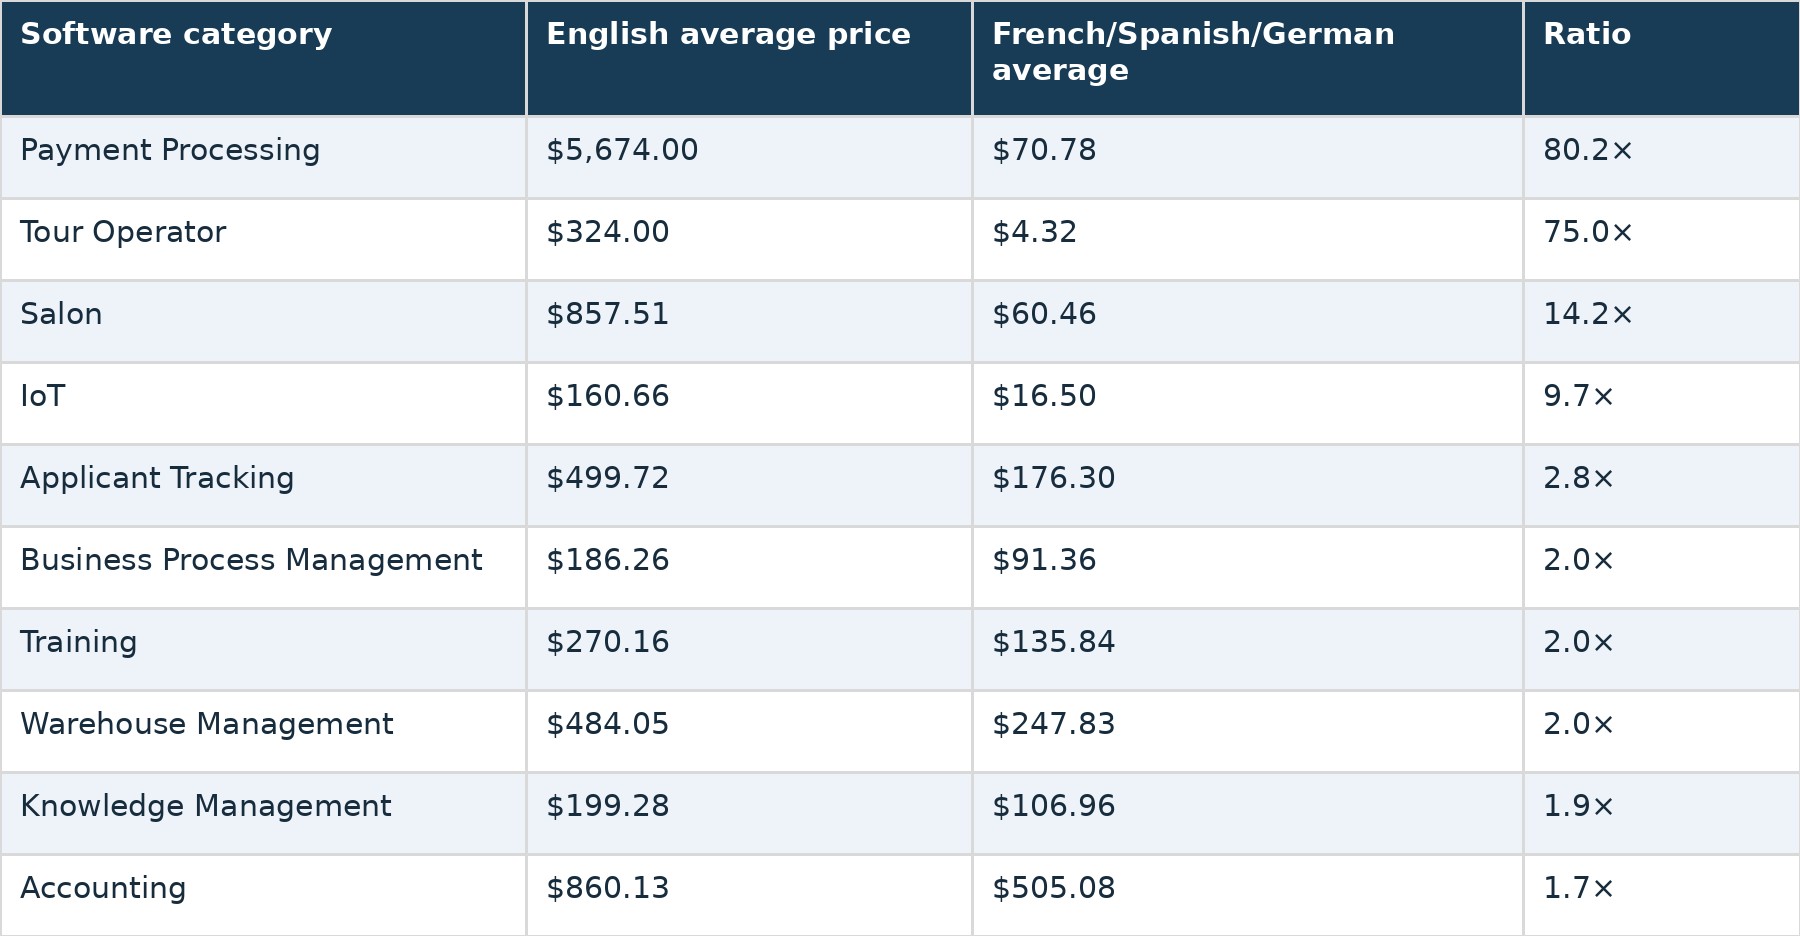
Payment Processing and Tour Operator are clear outliers in this selected comparison. The other eight categories show smaller ratios, ranging from approximately 1.7× to 14.2×. These are comparisons of recorded category averages, not controlled estimates of language-specific pricing premiums for identical software products.
Which SaaS Categories Appear Most Often Across Languages?
Although language coverage varies considerably, several large software categories recur in the language-category dataset. Learning Management System, Project Management and CRM appear frequently among the top three categories for the 12 languages with pricing data. For English, the largest categories are CRM (1,260 products), Payment Processing (1,140), and Project Management (1,134). For French, the leading categories are Project Management (934), Learning Management System (886), and Payment Processing (841).
Spanish and German both have Project Management and Learning Management System in their top two positions, followed by CRM. Arabic has a different top three: Learning Management System (281), Payment Processing (179), and School Management (165). These rankings describe the number of products declaring support for a language within each category. They do not establish customer demand or product usage by language.
Why Does SaaS Language Data Need Cleaning?
One of the report's most important findings concerns the reliability of the source field itself. The raw language sheet contains 999 nonblank rows, but not all of those rows represent distinct languages. Some entries are software category names, such as CRM or Compliance. Others are fragments of longer strings, such as “and Chinese.” The report identifies 161 non-language rows, approximately 16.1% of the raw entries. It also identifies 88 languages represented under duplicate labels, including variants with trailing punctuation or different capitalization.
These duplicates can understate language coverage when the counts are treated separately. For example, after merging duplicates: Korean coverage rises from 27.89% to 31.20%. Arabic rises from 14.03% to 16.31%. Portuguese rises from 58.55% to 60.15%. This illustrates why cleaning language labels is essential before drawing conclusions from software catalog data. The source report's cleaning process leaves 750 distinct language labels, although that count should not be confused with 750 independently verified natural languages.
What Do the Findings Mean for SaaS Businesses?
Three observations stand out. English support is widespread. More than nine in ten products in the stated catalog declare English availability. Multilingual support is uneven. Several European languages have relatively high coverage, while other major languages appear in much smaller proportions of the catalog.
Language-specific pricing averages require caution. The Payment Processing comparison contains an unusually large difference, but the aggregated data cannot determine whether language itself causes the gap. For SaaS vendors considering localization, the findings provide a benchmark for declared language availability in the catalog. They do not indicate which localization investments would generate the highest revenue or which languages customers most urgently need. Those decisions would require additional information about target markets, users, purchasing behavior and localization quality.
Methodology and Data Limitations
This analysis uses two sheets from Solevant's SaaS language dataset. The first contains 999 nonblank raw language rows with product counts. The second contains 1,000 language-category records with product counts and average pricing, covering 12 languages. The accompanying research note states a catalog size of 101,875 products. This total cannot be independently derived from the two sheets, so percentages based on it use the stated figure as their denominator.
The language sheet contains 760,521 declarations because products can support multiple languages and appear in multiple language totals. The analysis excludes entries identified as software categories or truncated text fragments and merges duplicate labels that differ by punctuation, capitalization or whitespace. Important limitations include: No collection date, reporting window or update schedule is provided. Language support is self-declared in the catalog data and does not measure translation quality. Product-level records are unavailable for validating individual declarations.
The catalog total of 101,875 is supplied as context rather than independently computed from the language sheets. Some language entries contain contamination or duplicate labels. The pricing data contains 12 missing average-price values. Pricing comparisons do not match identical products across languages. The source contains no language-speaker population figures or customer adoption measures. The results should therefore be interpreted as a snapshot of declared language support within the supplied catalog extract, not a comprehensive measure of worldwide SaaS localization.
Frequently Asked Questions
What percentage of SaaS products support English?
The cleaned data records English support for 94,154 products, representing 92.42% of the stated 101,875-product catalog.
Which languages have the highest SaaS coverage after English?
French, Spanish, German, Italian and Portuguese are next, with coverage ranging from 60.15% to 71.71%.
How much SaaS software supports Japanese and Chinese?
Japanese is recorded for 47,924 products (47.04%), while Chinese is recorded for 44,030 (43.22%).
Why are English-language Payment Processing prices so high in the dataset?
The recorded average is $5,674, substantially above the averages for other languages. The dataset does not identify the cause or show matched prices for identical products.
How many languages are represented in the source?
The report identifies 750 distinct cleaned language labels after removing non-language entries and merging duplicate forms.
Does the report show which languages SaaS customers prefer?
No. It measures declared product support, not customer preferences, usage or demand.
Conclusion
English dominates declared language support across Solevant's SaaS catalog, with coverage above 92% of the stated product base. French, Spanish, German, Italian and Portuguese also have broad coverage, while Dutch, several Asian languages and African languages occupy different positions in the distribution. The pricing analysis reveals unusually large differences in certain software categories, particularly Payment Processing, but those averages do not establish that language itself drives software prices. Perhaps most importantly, the research demonstrates how strongly data cleaning affects language-coverage results. For researchers, buyers and software vendors, the dataset offers a useful view of SaaS localization coverage—provided that its catalog scope, aggregation methods and limitations remain visible.