
Freemium Adoption in SaaS: Which Categories and Countries Offer Free Plans?
Freemium is a familiar SaaS pricing strategy, but it is far from universal. An analysis of Solevant's software catalog found that 10.55% of products in the category dataset offer a freemium tier. A separate country-level dataset recorded a slightly lower rate of 9.8%.
The differences become more pronounced when looking at individual software categories. Digital Signature leads larger categories with 36.01% freemium adoption, while Warehouse Management, Loan Origination, and several other established categories record no freemium products. Country-level results also vary substantially. Cyprus leads the countries with sufficient product coverage at 31.46%, compared with just 1.71% for Ghana. So, which software categories are most likely to offer free plans, and do product prices or category size help explain the differences?
Key Findings
- 10.55% of products in the category dataset offer freemium, compared with 9.8% in the separate country dataset.
- 202 of 1,000 categories record no freemium products.
- 22 categories with at least 100 products have freemium adoption above 25%.
- Digital Signature has the highest freemium rate among those larger categories, at 36.01%.
- Ten categories with at least 100 products record exactly 0% freemium adoption.
- CRM leads the 30 largest software categories with 24.43% adoption.
- Cyprus has the highest country-level adoption rate at 31.46%, while Ghana has the lowest at 1.71%, among countries with at least 15 products.
- Freemium adoption has almost no linear relationship with average price (r = -0.058) or category size (r = -0.009).
How Common Is Freemium Pricing in SaaS?
Freemium is a pricing model in which a software product offers a permanent free tier alongside paid plans. Unlike a free trial, which expires after a specified period, a freemium plan can remain available indefinitely, although features, usage, or storage may be limited. Solevant's research examines freemium availability from two perspectives.

The two datasets contain different product totals. Their rates therefore cannot be combined into one overall figure. Nevertheless, both suggest that approximately one in ten recorded SaaS products offers a permanent free tier. This is a measure of freemium availability within Solevant's catalog, not the percentage of SaaS customers using free plans.
How Is Freemium Adoption Distributed Across Software Categories?
Freemium availability differs substantially across the 1,000 categories analyzed.
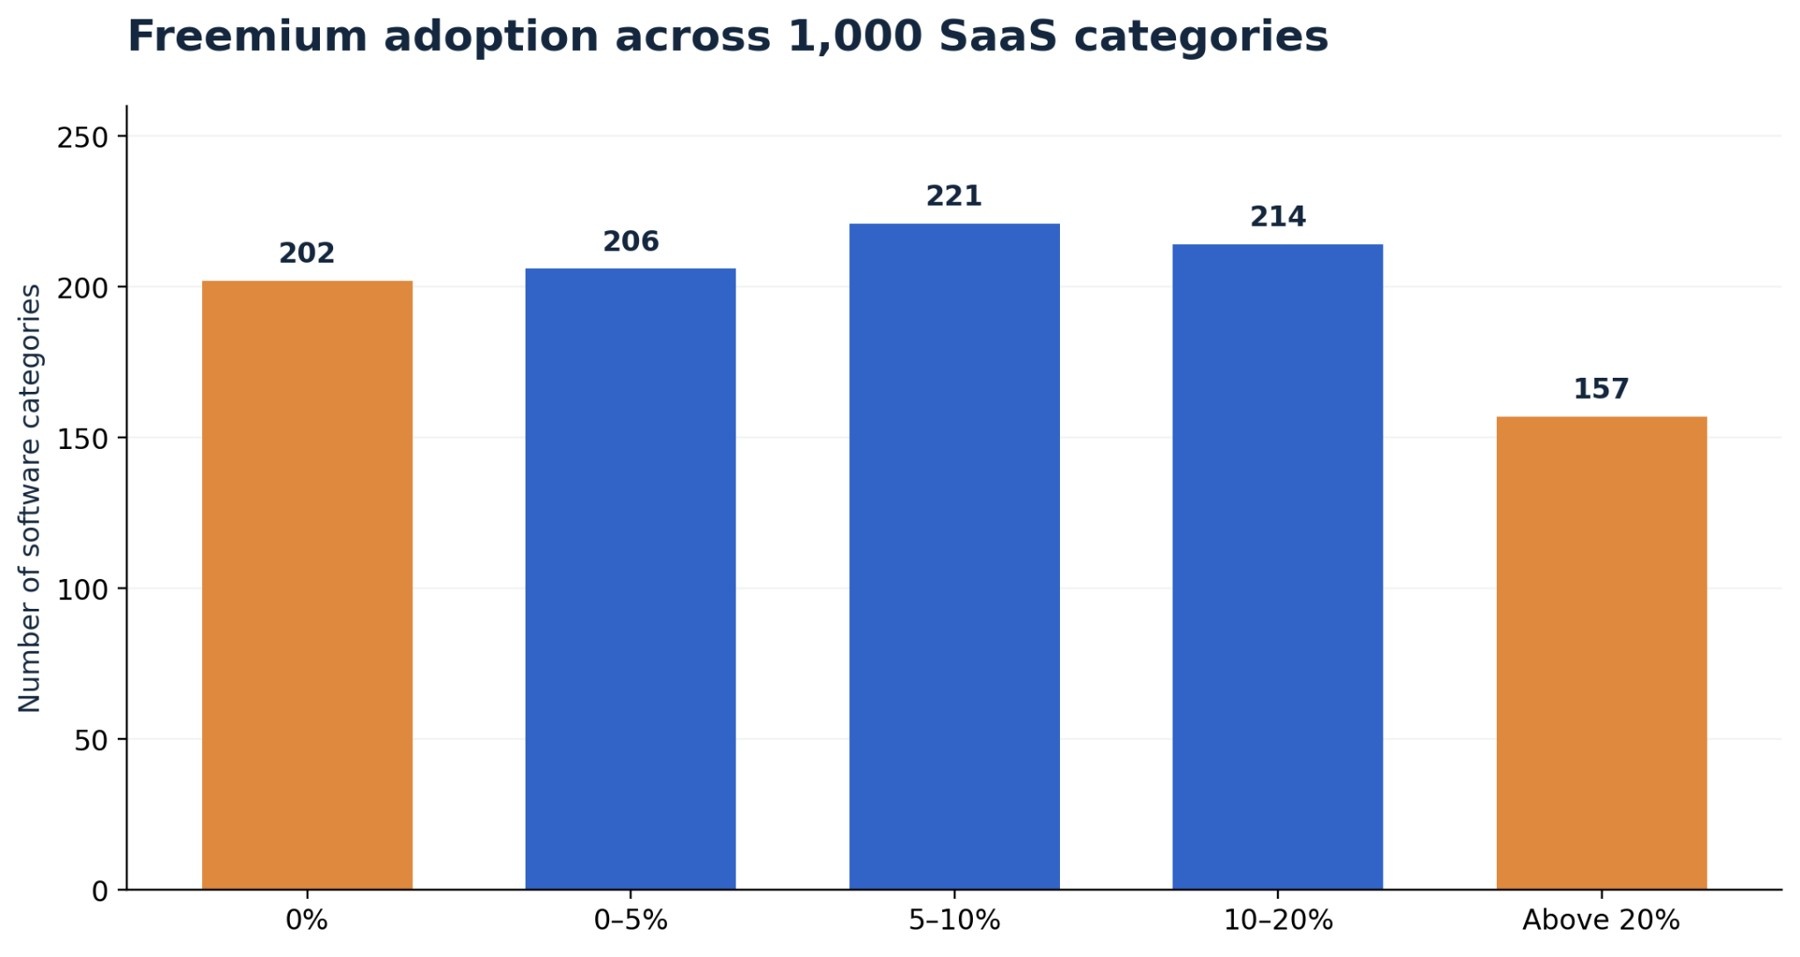
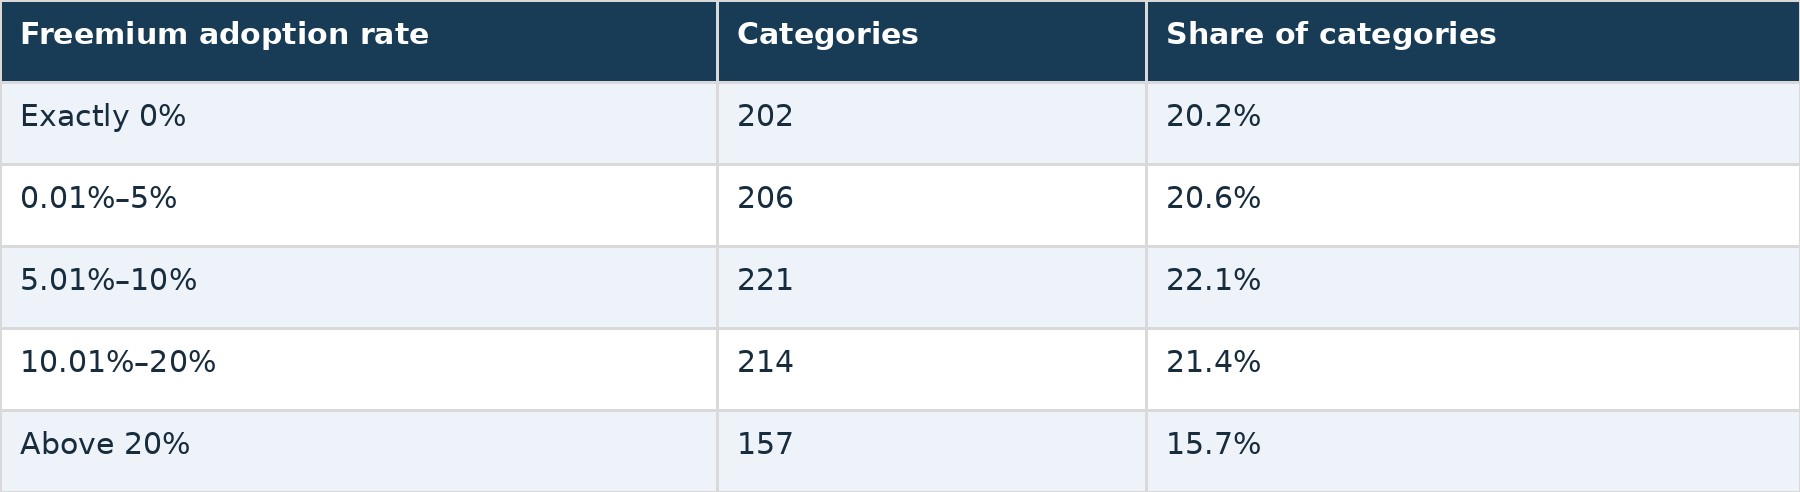
The largest group consists of 221 categories with freemium adoption between 5.01% and 10%. Another 202 categories have no recorded freemium products. At the opposite end, 157 categories have adoption rates above 20%. This distribution shows that freemium is not consistently used across software categories. Some have substantial free-tier availability, while others rely almost entirely on products without permanent free plans.
Which SaaS Categories Have the Highest Freemium Adoption?
Among categories containing at least 100 products, Digital Signature has the highest freemium adoption rate at 36.01%. Influencer Marketing follows closely at 35.94%, while Database ranks third at 34.05%. Time Tracking and Data Extraction also exceed 33%.
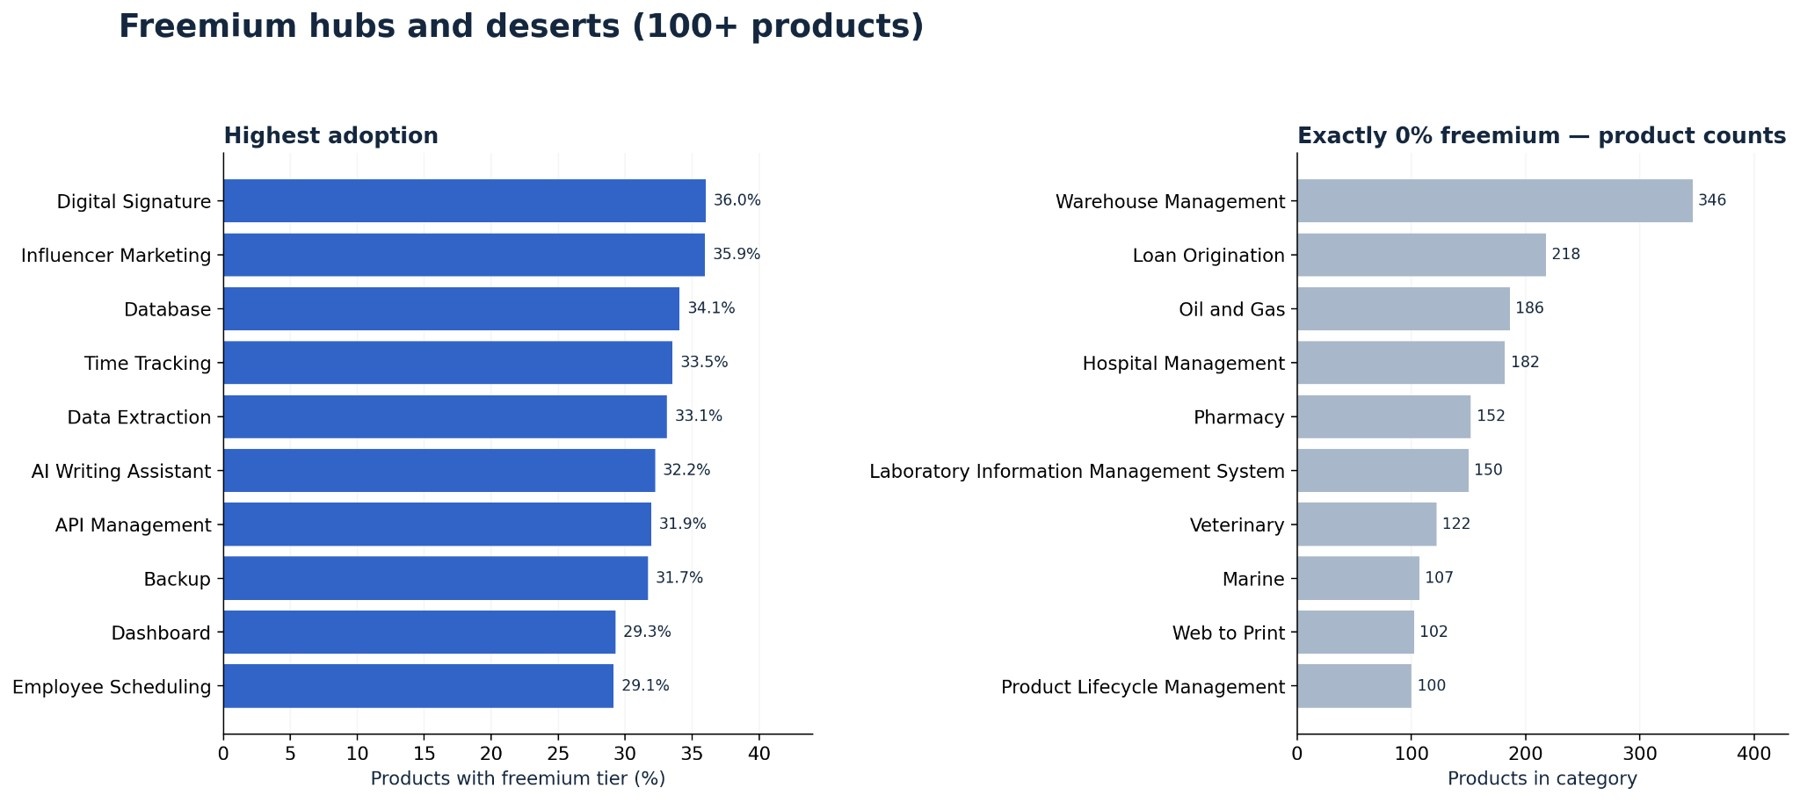
The leading categories include:
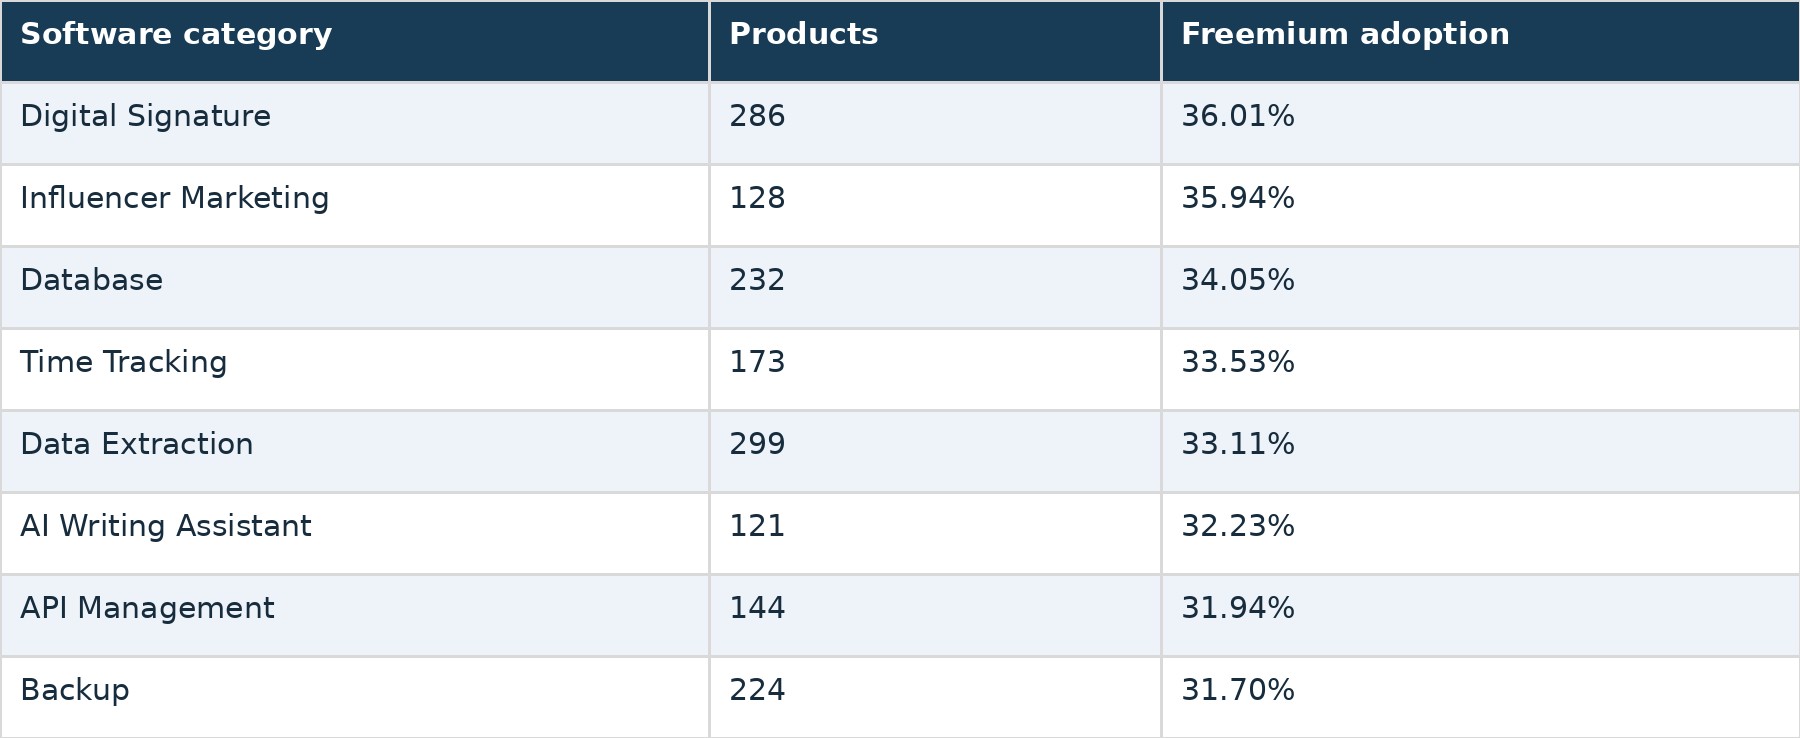
In total, 22 categories with at least 100 products exceed 25% freemium adoption. These categories represent areas of the catalog where permanent free tiers are relatively common. However, the data does not explain why individual vendors offer free plans or whether those plans produce higher customer acquisition or conversion rates.
Which SaaS Categories Have No Freemium Products?
At the other end of the distribution, ten categories with at least 100 products record exactly 0% freemium adoption. They include:
- Warehouse Management — 346 products
- Loan Origination — 218 products
- Oil and Gas — 186 products
- Hospital Management — 182 products
- Pharmacy — 152 products
- Laboratory Information Management System — 150 products
- Veterinary — 122 products
- Marine — 107 products
- Web to Print — 102 products
- Product Lifecycle Management — 100 products
These categories have substantial product representation but no recorded permanent free tiers. A separate group has very low, rather than zero, adoption. For example, Supply Chain Management records 0.40%, Tour Operator 0.48%, Manufacturing Execution 0.66%, and Retail POS System 0.77%. This distinction is important: a category with one or two freemium products should not be classified as having none. The differences may reflect product complexity, implementation requirements, or business models, but the dataset does not establish those explanations.
Do Larger SaaS Categories Offer More Freemium Plans?
A category's product count does not reliably indicate how common freemium pricing will be. Among the 30 largest software categories, CRM leads with 24.43% freemium adoption across 1,392 products. Email Marketing follows at 23.16%, while Application Development records 22.79%. By contrast, other large categories have much lower rates.
Enterprise Resource Planning records 6.94% across 1,254 products. Payment Processing records 2.81% across 1,211 products, while School Management has just 1.94% across 619. These differences demonstrate that large software categories can have very different freemium profiles. The correlation between category product count and freemium adoption is -0.0087, effectively zero as a linear relationship. Category size alone therefore offers little help in predicting freemium availability within this dataset.
Does SaaS Pricing Affect Freemium Adoption?
A common assumption is that lower-priced software categories are more likely to offer free plans. Solevant's data does not show a meaningful linear relationship between average category price and freemium adoption. Across categories with recorded pricing information, the Pearson correlation is -0.0583.
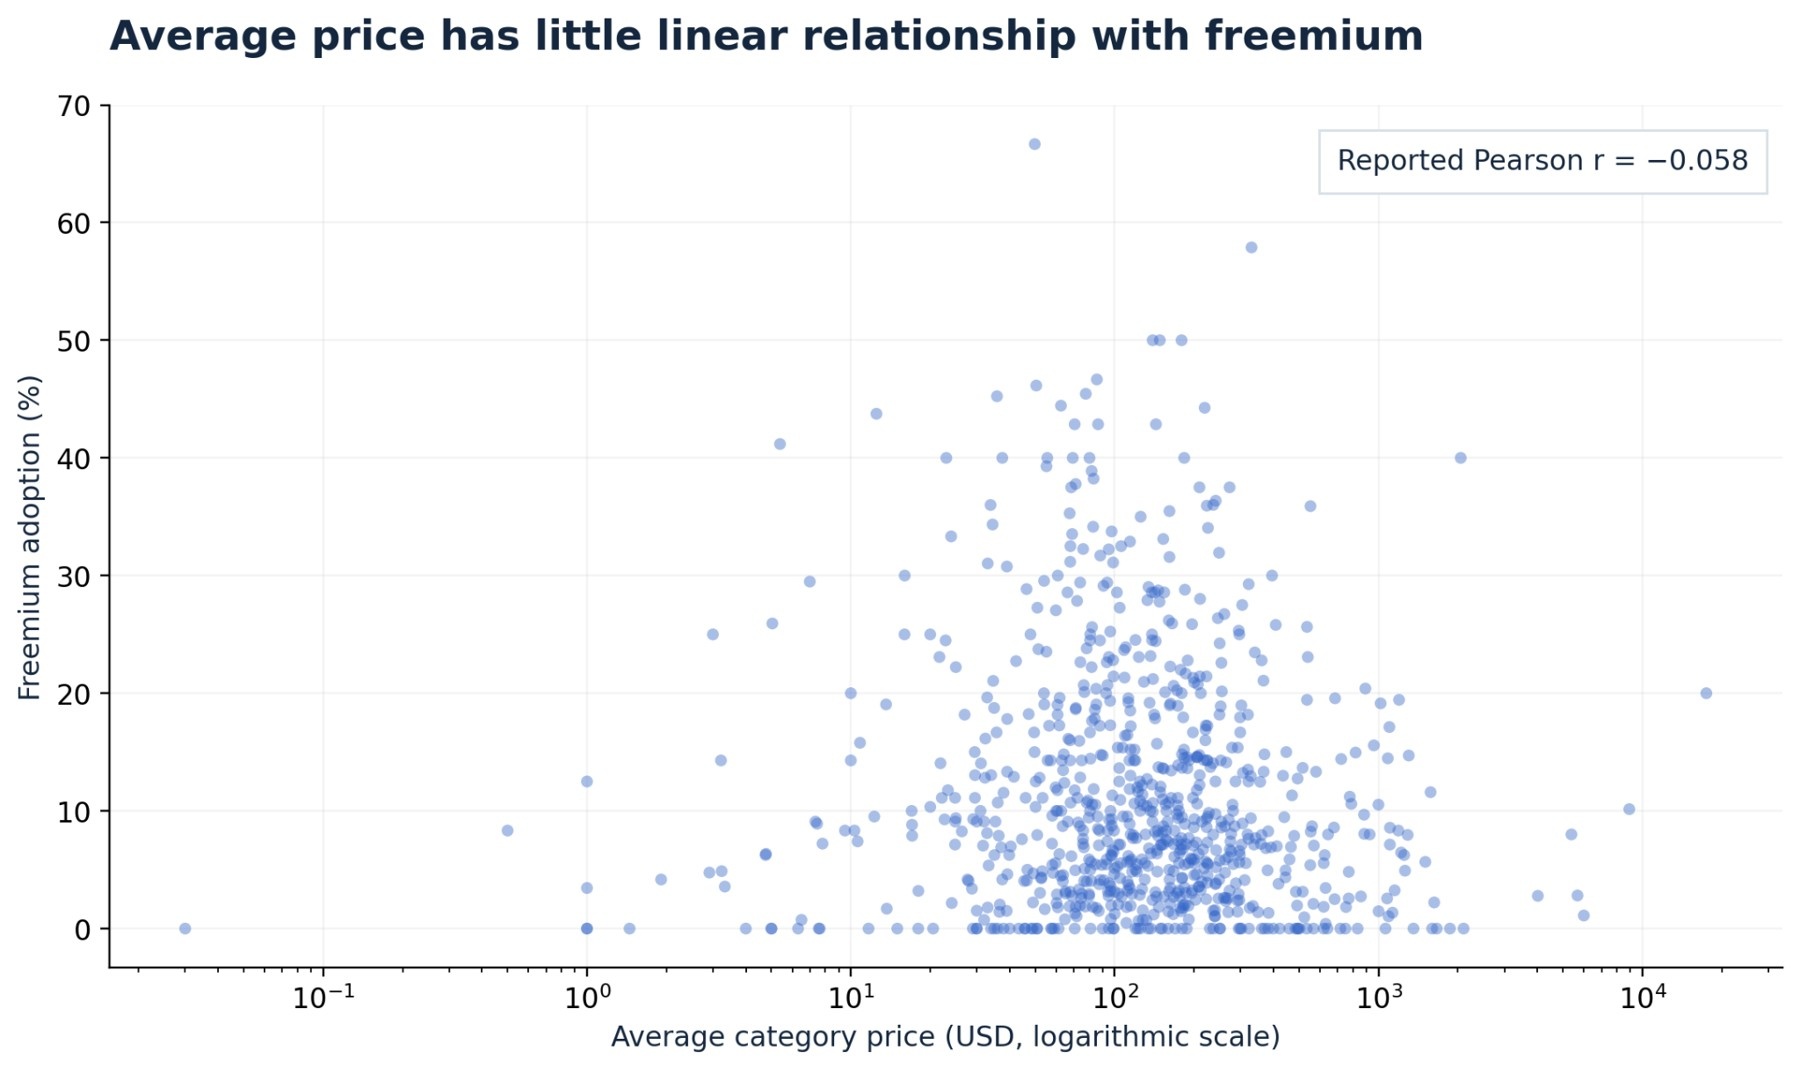
The relationship is slightly negative but very weak. Examples from the largest categories illustrate the variation. Payment Processing has an average recorded price of $5,674 and a freemium rate of 2.81%. Website Builder averages $88 but also has relatively low freemium adoption, at 4.13%. Meanwhile, Billing and Invoicing averages $536 and records a much higher freemium rate of 19.44%.
These examples show that categories with very different average prices can have similarly low freemium adoption, while some higher-priced categories still offer free tiers relatively frequently. The analysis uses category-level average prices rather than individual product prices. It also does not establish whether a vendor's free tier influences the pricing of its paid plans.
Which Countries Have the Highest Freemium Adoption?
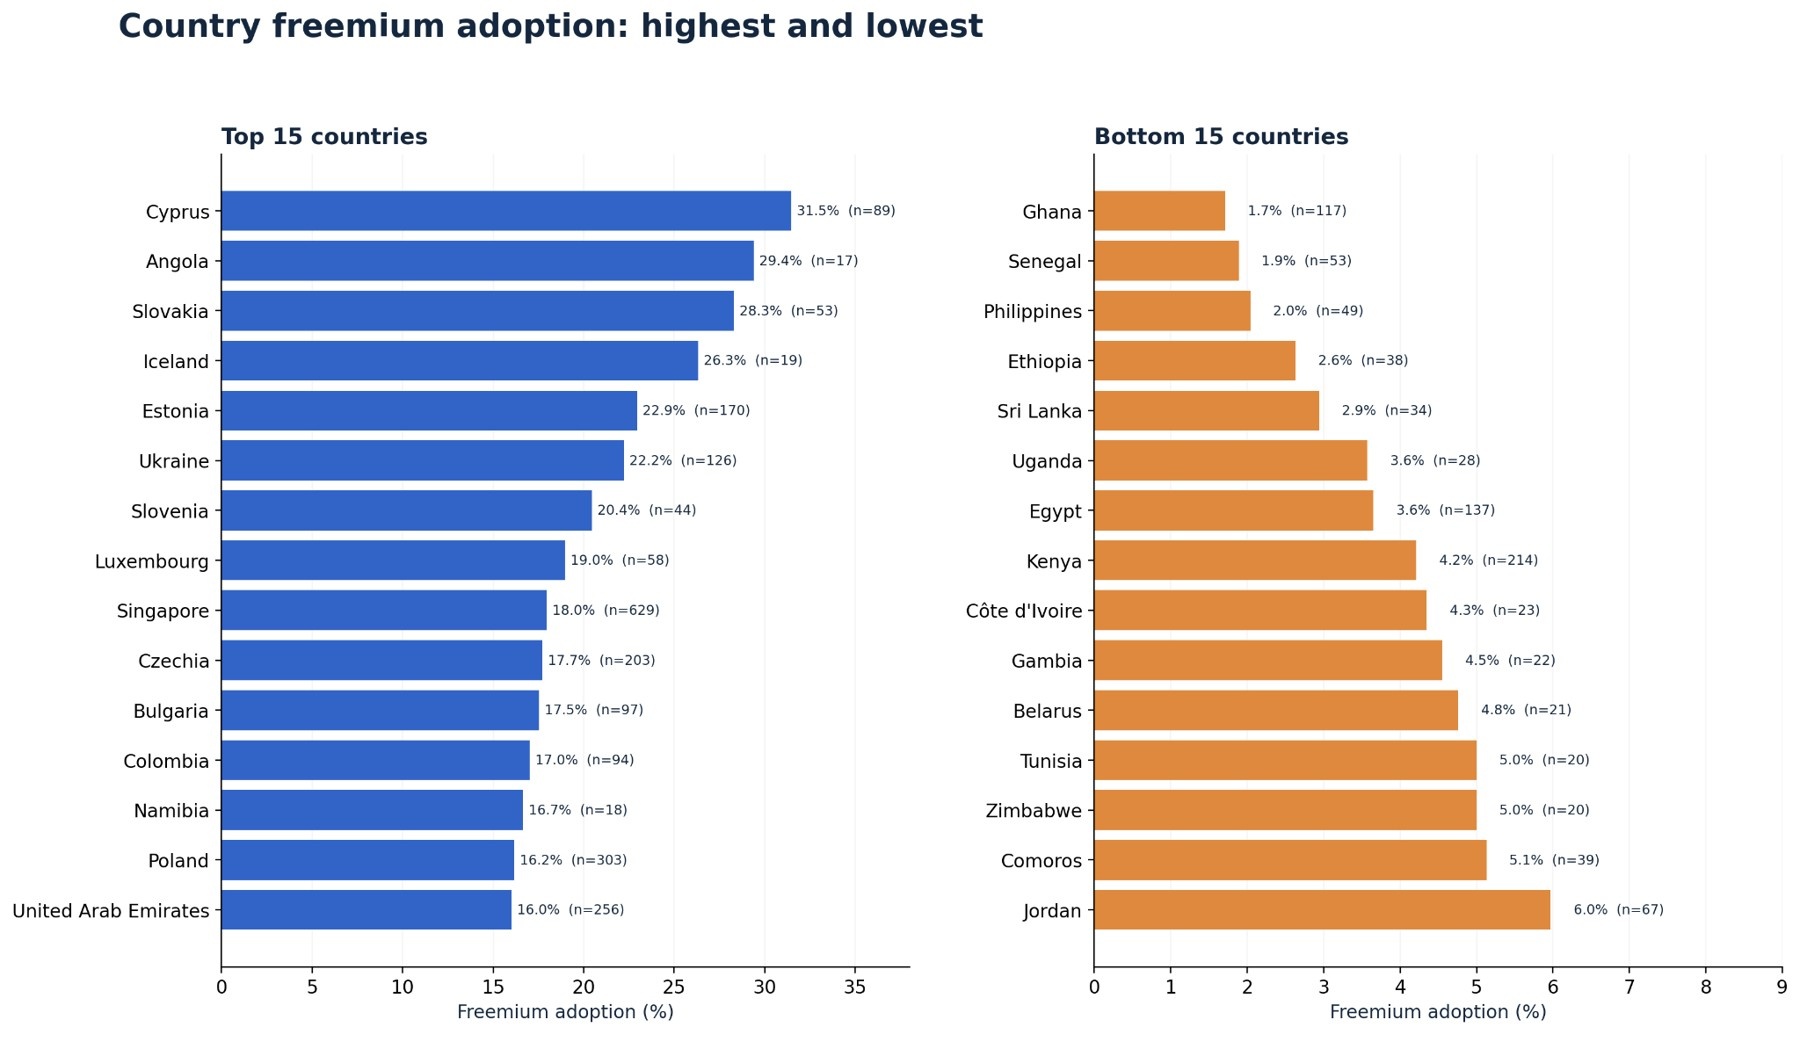
Freemium adoption also varies considerably by country. The report includes 118 countries, but country rankings use only the 91 countries with at least 15 products to reduce the influence of very small samples. Cyprus leads at 31.46%, followed by Angola at 29.41% and Slovakia at 28.30%.
Selected countries with relatively high adoption include:
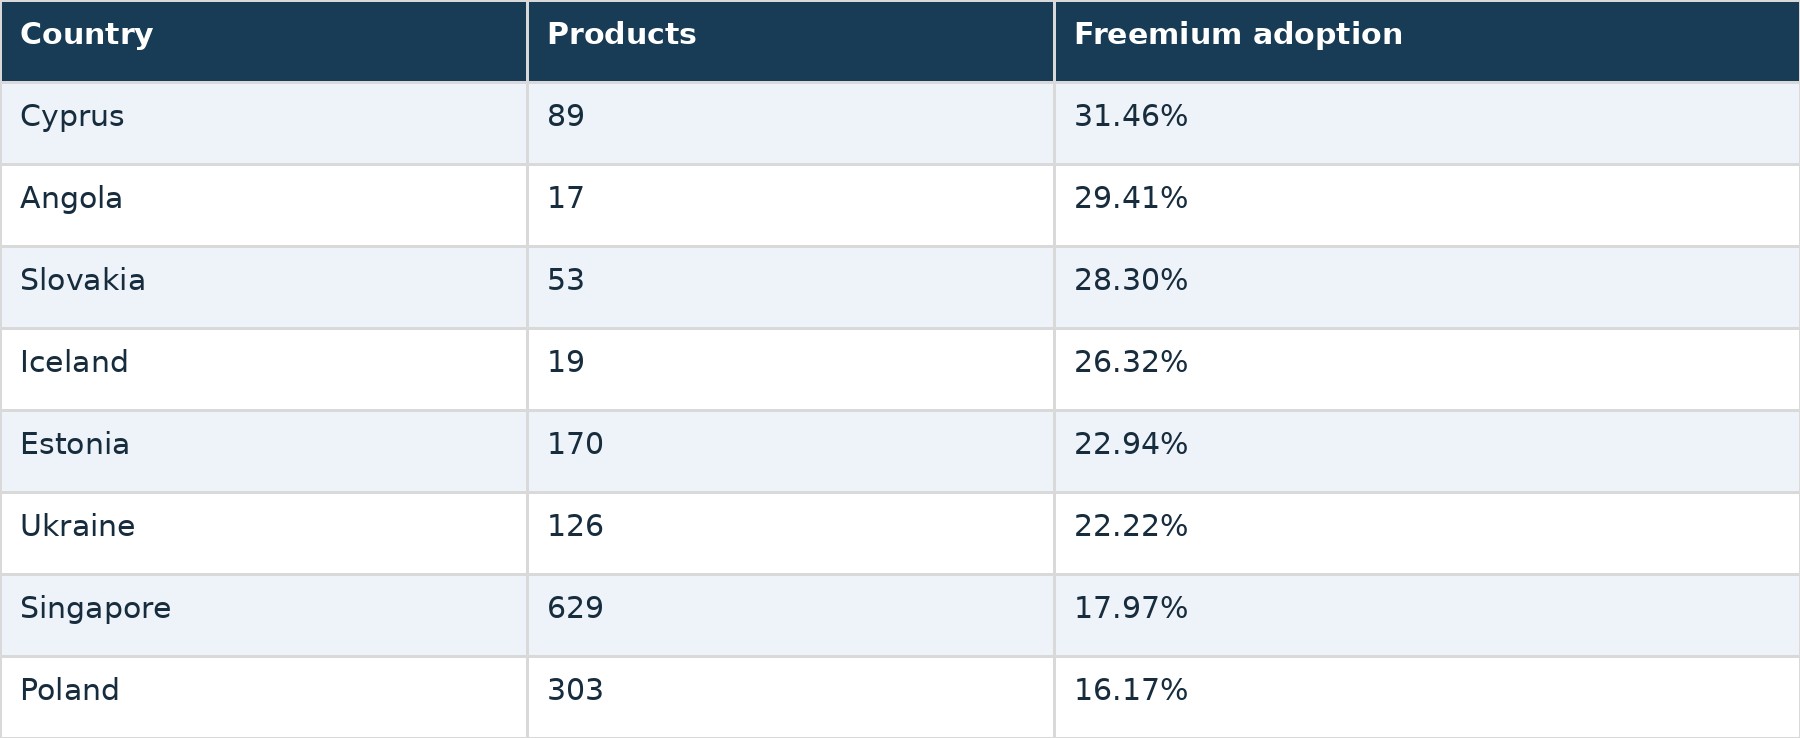
Eight of the top 15 countries are classified in the report as Eastern or Central European. Singapore is also notable because its 17.97% freemium rate is based on 629 products, a substantially larger sample than several countries near the top. Country rankings should nevertheless be interpreted cautiously. A higher recorded rate does not establish that users in that country prefer free plans or that local vendors follow a particular pricing strategy.
Which Countries Have the Lowest Freemium Adoption?
Ghana records the lowest freemium rate among countries meeting the minimum product threshold, at 1.71%. Senegal follows at 1.89%, while the Philippines records 2.04%. Other countries with relatively low rates include Ethiopia (2.63%), Uganda (3.57%), Egypt (3.65%), and Kenya (4.21%). Eleven of the bottom 15 countries are African markets. However, the figures describe the proportion of products with recorded freemium options, not the affordability of software, local purchasing power, or demand for free products.
What About Nigeria?
Nigeria provides an important example of why the underlying dataset matters. The country sheet records 419 products and 8.11% freemium adoption. A separate source note references a lower figure of 2.9%, but that does not match the country dataset used in this analysis. For consistency, this article uses the 8.11% figure from the supplied country sheet. Nigeria therefore sits outside the bottom-15 group and closer to the middle of the eligible country distribution.
What Factors Are Associated With Freemium Adoption?
The report includes five precomputed Pearson correlations examining relationships between pricing, product count, industry breadth, and freemium availability.
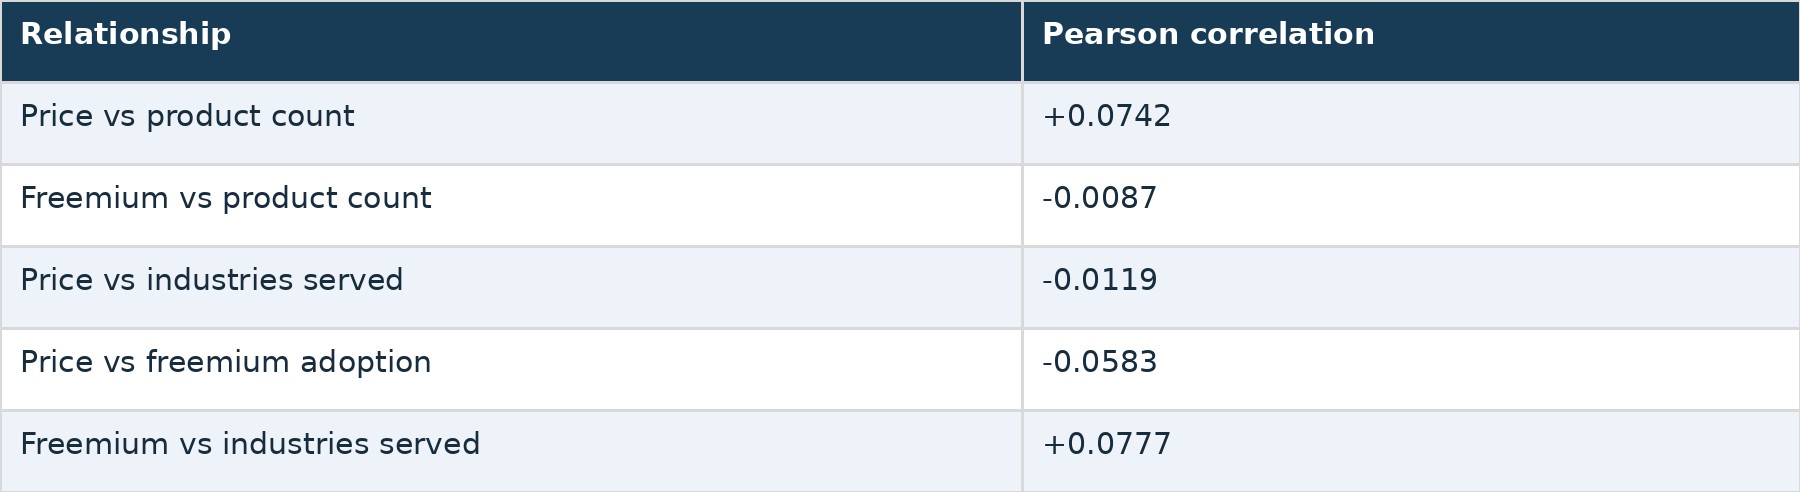
Every coefficient is below 0.08 in absolute value. The strongest relationship is between freemium adoption and the average number of industries served, at +0.0777. Even this is a very weak positive association. The results indicate that none of these variables has a substantial linear relationship with freemium adoption in the supplied category-level data. This does not rule out more complex relationships or the influence of factors that were not measured.
What Do the Findings Mean for SaaS Businesses?
First, freemium is a minority pricing strategy. Both datasets place adoption close to one in ten products. Second, software category matters descriptively. Free tiers are common in some categories, such as Digital Signature and Database, but absent from several categories with hundreds of products.
Third, simple measures such as price and category size are poor predictors of freemium availability. The correlations are too weak to support a general rule. For SaaS founders evaluating pricing strategies, the data provides a category-level benchmark. It does not demonstrate that introducing a free plan will improve acquisition, revenue, retention, or profitability. Those questions require product-level performance data beyond the scope of this research.
Methodology and Data Limitations
This research uses Solevant's freemium category and country datasets, together with five precomputed correlation coefficients. The category dataset contains 1,000 category records covering 98,323 product counts. The country dataset contains 118 country records covering 82,068 product counts. Overall freemium rates are calculated using product-count weighting within each dataset. Freemium is defined as a permanent free tier, not a time-limited free trial.
The analysis applies minimum sample thresholds of 100 products for comparisons of high- and zero-freemium categories and 15 products for country rankings. Several limitations are important: The category and country datasets have different product totals and cannot be reconciled into one overall adoption rate. The source does not provide a collection date, reporting period, or update schedule. The category-level data does not identify individual products or customer usage.
Average price is missing for 165 categories. Some small-country samples remain sensitive to a few product records. Correlation coefficients are descriptive and do not establish causation. The source materials contain several conflicting figures, including the previously cited Nigeria rate; this article follows the figures reported in the underlying analysis tables. Accordingly, the findings describe freemium availability within Solevant's supplied catalog, not the current worldwide adoption rate of freemium SaaS.
Frequently Asked Questions
What percentage of SaaS products offer freemium plans?
Solevant's category dataset records a 10.55% product-weighted freemium rate, while its separate country dataset records 9.8%.
What is the difference between freemium and a free trial?
Freemium provides an ongoing free tier, usually with limitations. A free trial provides temporary access that expires after a specified period.
Which SaaS category has the highest freemium adoption?
Digital Signature leads among categories with at least 100 products, at 36.01%.
Which country has the highest freemium adoption?
Cyprus leads at 31.46% among countries with at least 15 products.
Does cheaper SaaS software offer freemium more often?
Not consistently. The correlation between average category price and freemium adoption is -0.0583, indicating a very weak linear relationship.
Is freemium more common in larger software categories?
Not necessarily. The correlation between category product count and freemium adoption is -0.0087, effectively zero.
Conclusion
Freemium pricing is available in only a minority of the SaaS products represented in Solevant's research, but adoption varies substantially by category and country. Digital Signature, Influencer Marketing, and Database have some of the highest freemium rates among larger categories. Meanwhile, several established software categories record no permanent free tiers.
Country-level comparisons show similar variation, with Cyprus leading and Ghana ranking lowest among countries with sufficient product coverage. The research also finds that average price, category size, and industry breadth have little linear association with freemium adoption. Together, these findings show why freemium pricing is better understood through specific software categories and catalog segments than through a single market-wide assumption.