
SaaS Mobile App Availability: iOS, Android and Pricing Across 101,868 Products
How many SaaS products offer a mobile app—and does mobile availability affect their price? Solevant's analysis of 101,868 software directory listings identifies 6,880 products with a recorded iOS or Android app, equivalent to 6.75% of the catalog. Among those products, support for both platforms is overwhelmingly more common than support for just one. Nearly 89% offer both iOS and Android apps.
The pricing data reveals another distinction: products offering only an iOS app have a higher median monthly price than Android-only products, while products with no recorded mobile app have higher average prices than products supporting both platforms. But these findings require context. Mobile-deployment information is missing for almost half of the catalog, and pricing comparisons cover only products with published prices.
Key Findings
- 6,880 of 101,868 products (6.75%) have a recorded mobile app.
- 6,121 mobile-enabled products (89%) support both iOS and Android.
- Only 386 products are iOS-only, compared with 373 Android-only.
- Mobile-deployment information is missing for 50,404 listings (49.48%).
- The median monthly price for iOS-only products is $54, versus $35.03 for Android-only products—a 54% difference.
- Products supporting both platforms have an average monthly price of $136.40, compared with $293.69 for products recorded as having no mobile app.
- CRM leads the category ranking with 98 priced mobile products, followed by Field Service Management with 61.
- Among priced products, mobile availability ranges from 19.4% in the under-$25 monthly price band to 3.3% above $5,000.
How Common Are Mobile Apps Among SaaS Products?
The research classifies each product into one of five mobile-deployment groups: both platforms, iOS only, Android only, no mobile app, or unknown.
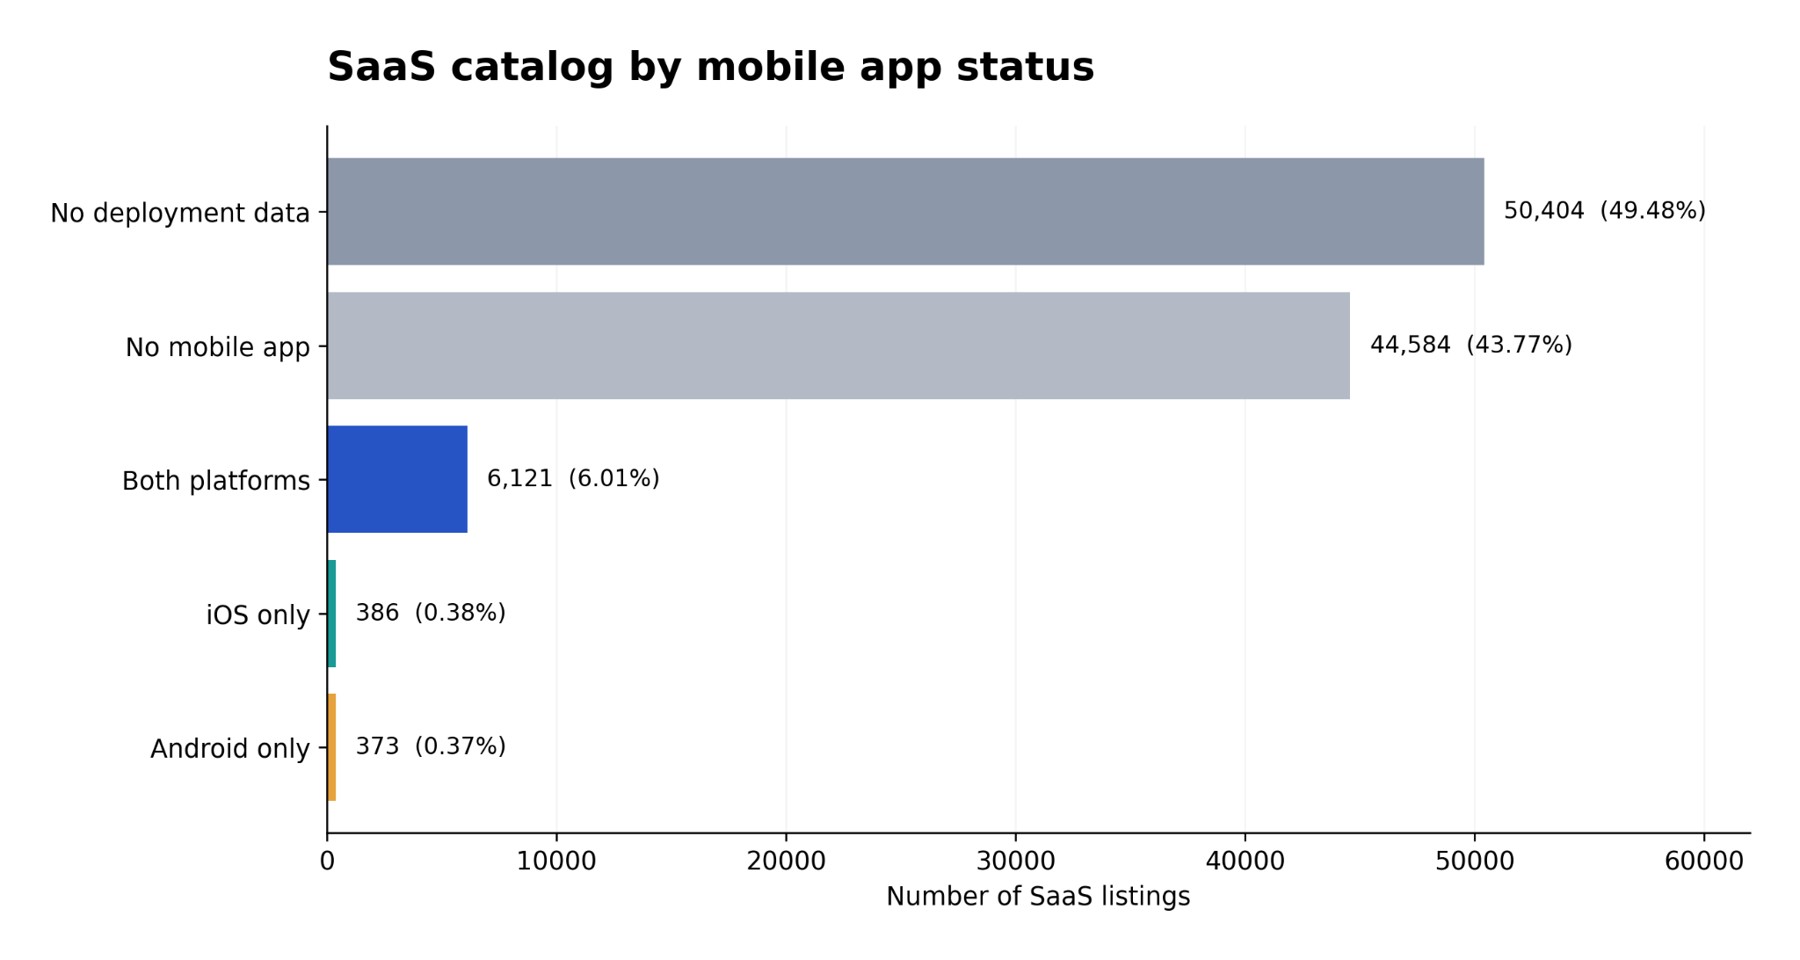
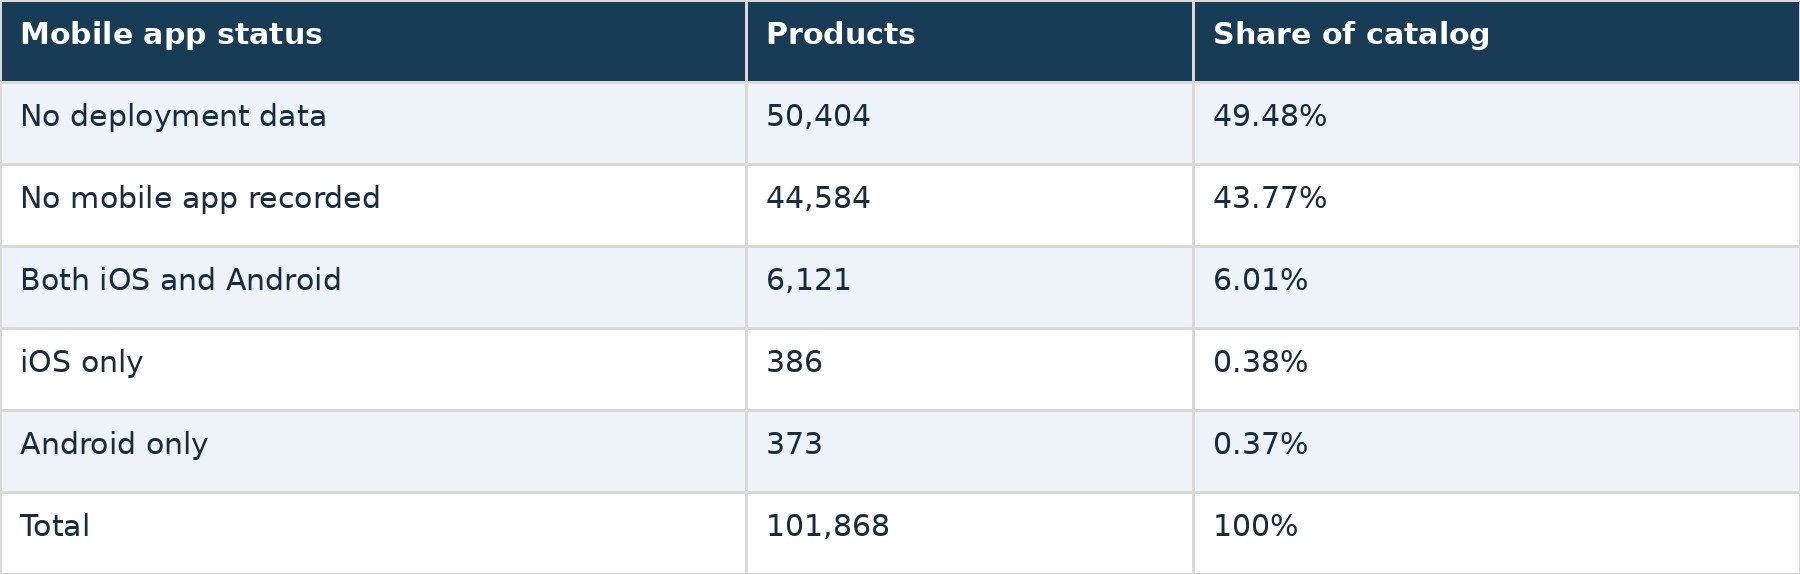
The largest group consists of products with no mobile-deployment data. Another 44,584 products are classified as having no mobile app. Together, these two groups represent more than 93% of the directory. However, they should not be treated as identical: a product with unknown deployment information might still offer mobile access. The confirmed mobile-app share is therefore 6.75% of the entire catalog, but the data cannot establish the true mobile-app rate among products whose status is unknown.
Do Most Mobile SaaS Products Support Both iOS and Android?
Yes. Among the 6,880 products with a recorded mobile app, 6,121 support both iOS and Android. That represents approximately 89% of the mobile-enabled group. Only 386 products offer iOS without Android, while 373 offer Android without iOS. The difference between the two single-platform groups is just 13 products.
This suggests that within the directory's confirmed mobile-enabled products, supporting both major platforms is much more common than choosing one exclusively. The data records whether each app exists. It does not indicate whether the iOS and Android versions have identical features, performance, or levels of support.
Is iOS-Only SaaS More Expensive Than Android-Only SaaS?
Among products with published monthly prices, iOS-only SaaS listings have higher prices than Android-only listings at every measured point in the distribution. The median iOS-only price is $54 per month, compared with $35.03 for Android-only products. That's a difference of approximately 54%.
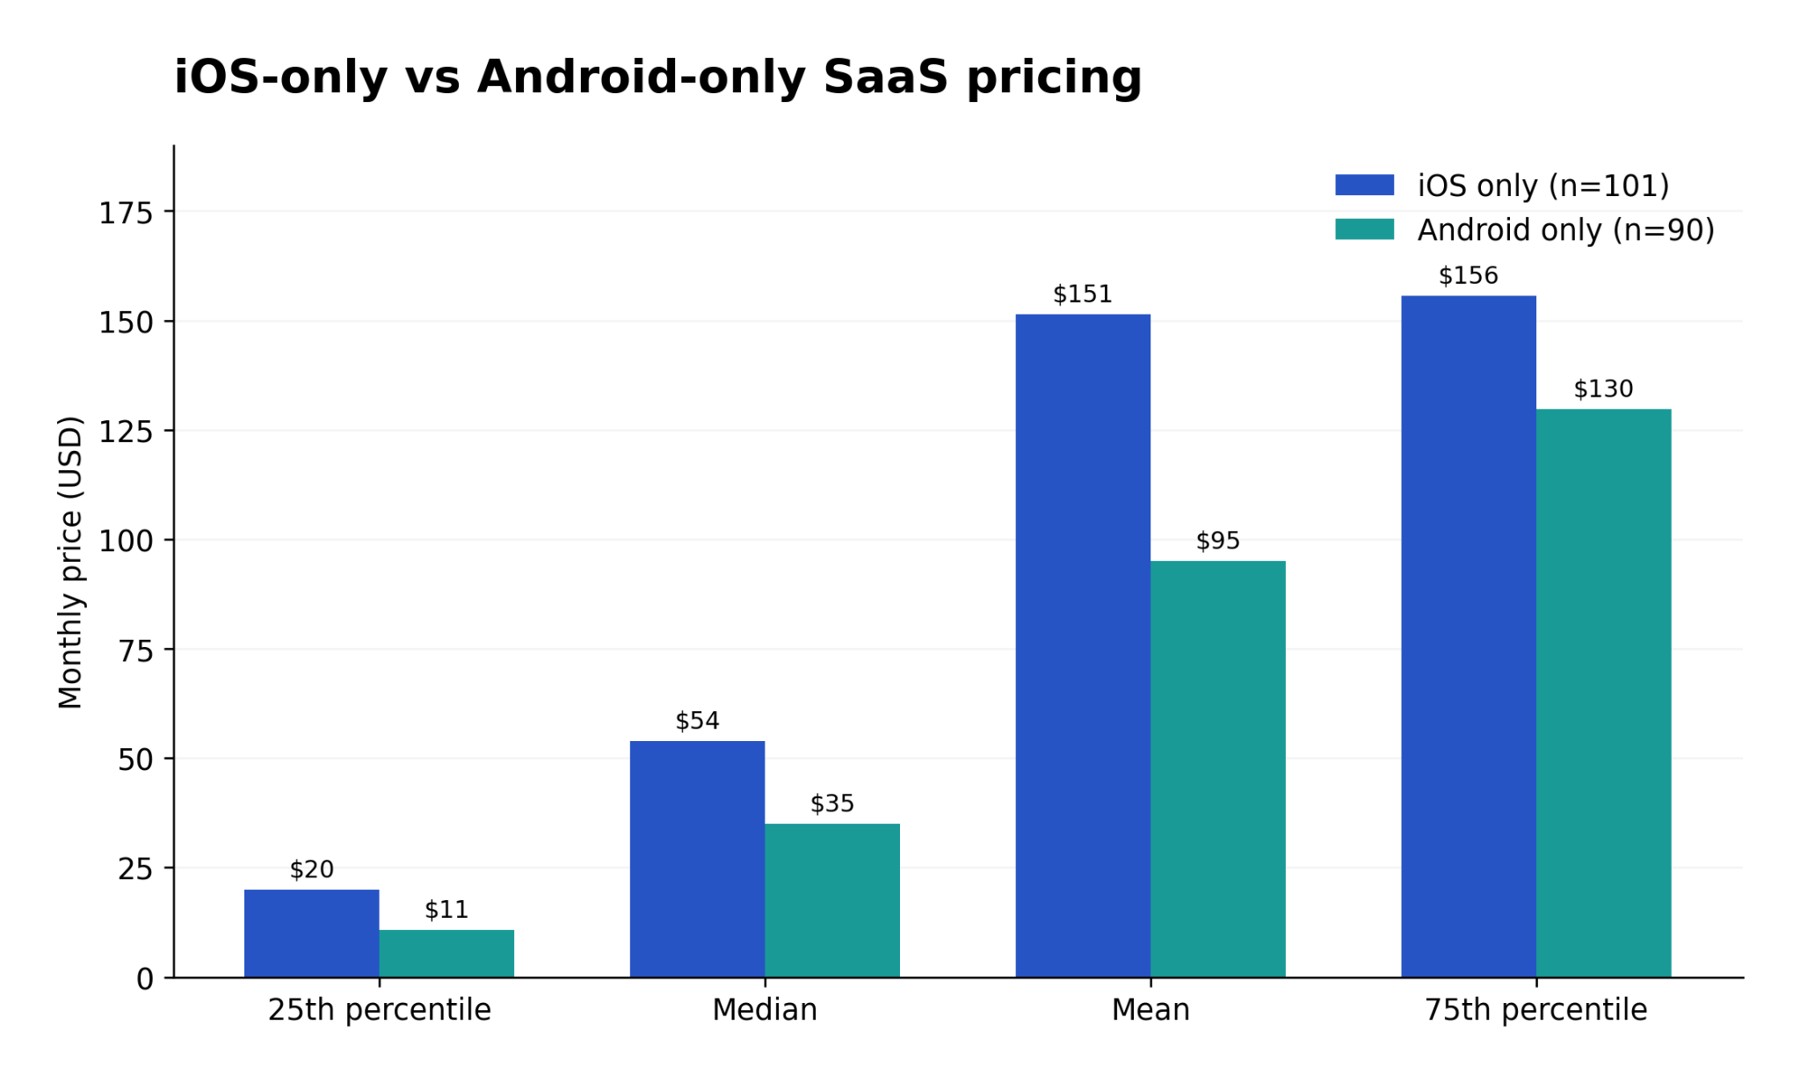
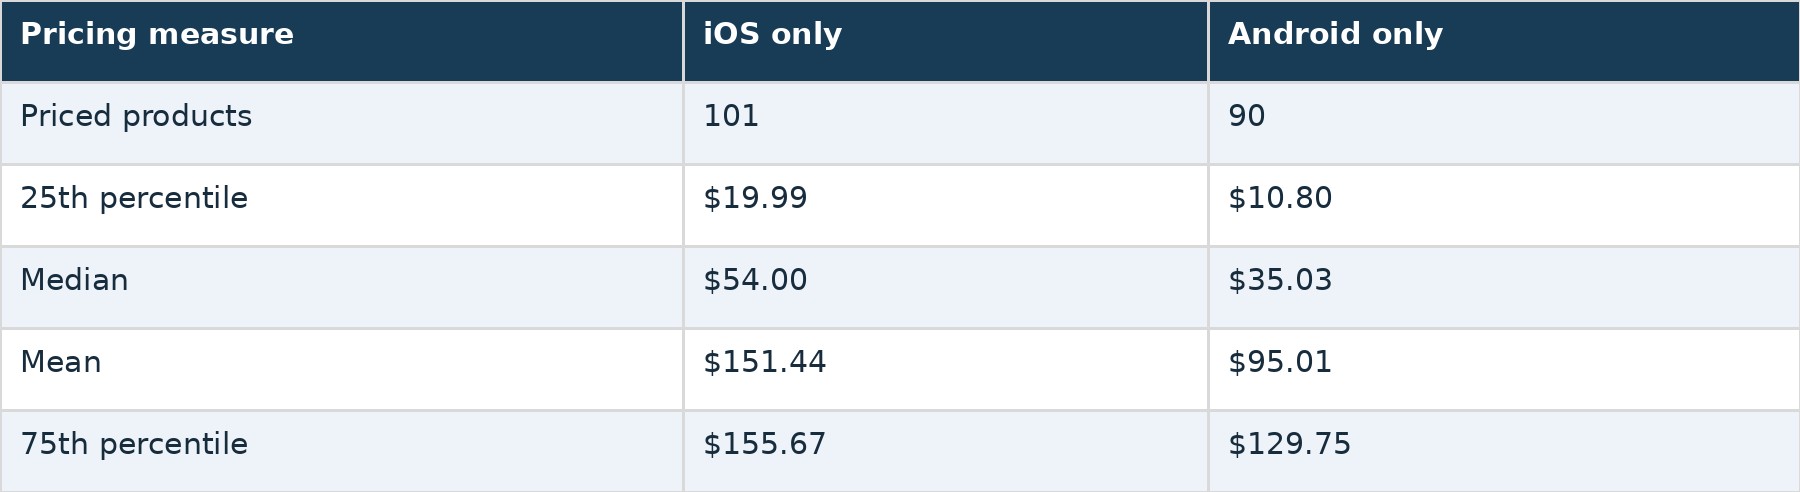
The largest proportional difference appears at the lower end of the price distribution. At the 25th percentile, iOS-only products cost approximately 85% more than Android-only products. At the 75th percentile, the difference narrows to around 20%. The mean price is also higher for iOS-only products, although averages can be more sensitive to unusually expensive listings. These comparisons involve only 191 priced single-platform products. They do not establish that iOS support causes higher prices or that identical products are more expensive on iOS. Different software categories, feature sets, and product types may contribute to the observed difference.
Are SaaS Products With Mobile Apps More Expensive?
The broader pricing comparison tells a different story. Products supporting both mobile platforms have a mean monthly price of $136.40 and a median of $46.44. Products recorded as having no mobile app have a higher mean of $293.69 and a median of $60.67.
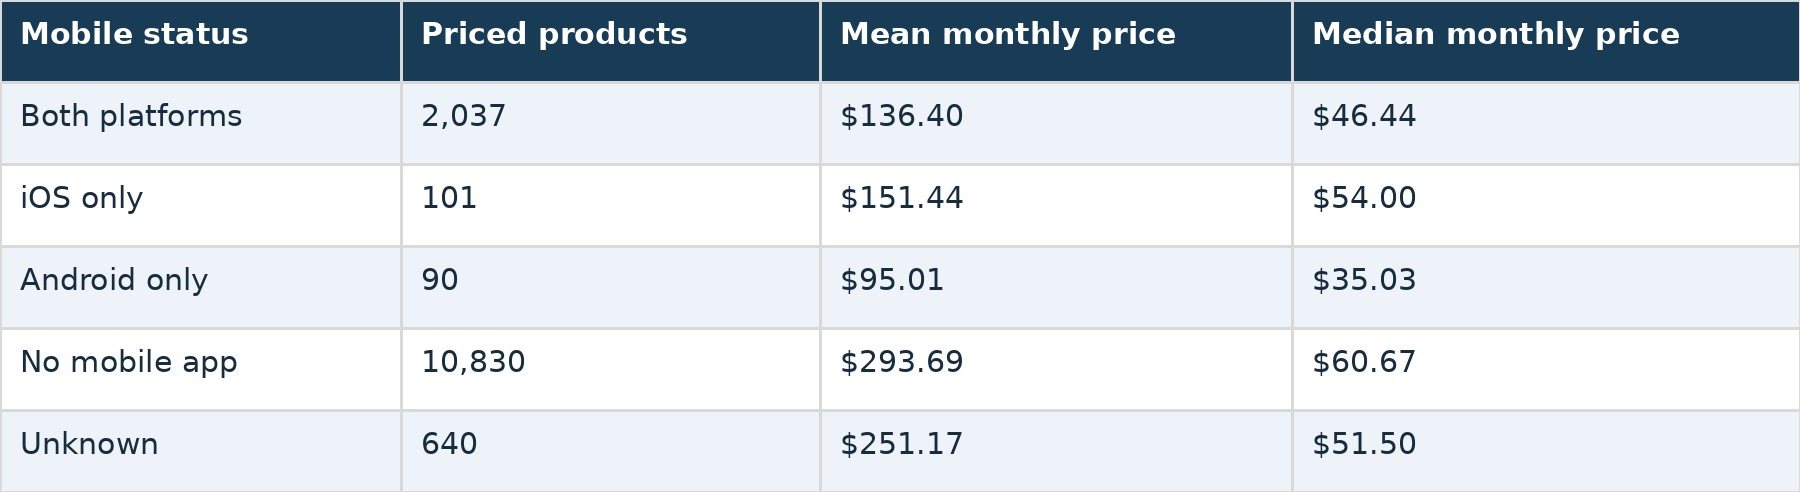
The mean price of no-mobile products is approximately 2.15 times that of products supporting both platforms. The median gap is considerably smaller. This indicates that higher-priced observations influence the averages, particularly within the no-mobile group. The data does not explain the cause. Mobile availability could be associated with differences in product category, customer type, pricing structure, or other characteristics not controlled for in this comparison.
Which SaaS Categories Have the Most Mobile Apps?
CRM has the highest number of priced mobile products in the category analysis, with 98. Field Service Management follows with 61, while Project Management has 48. Collaboration and Construction Management round out the top five.
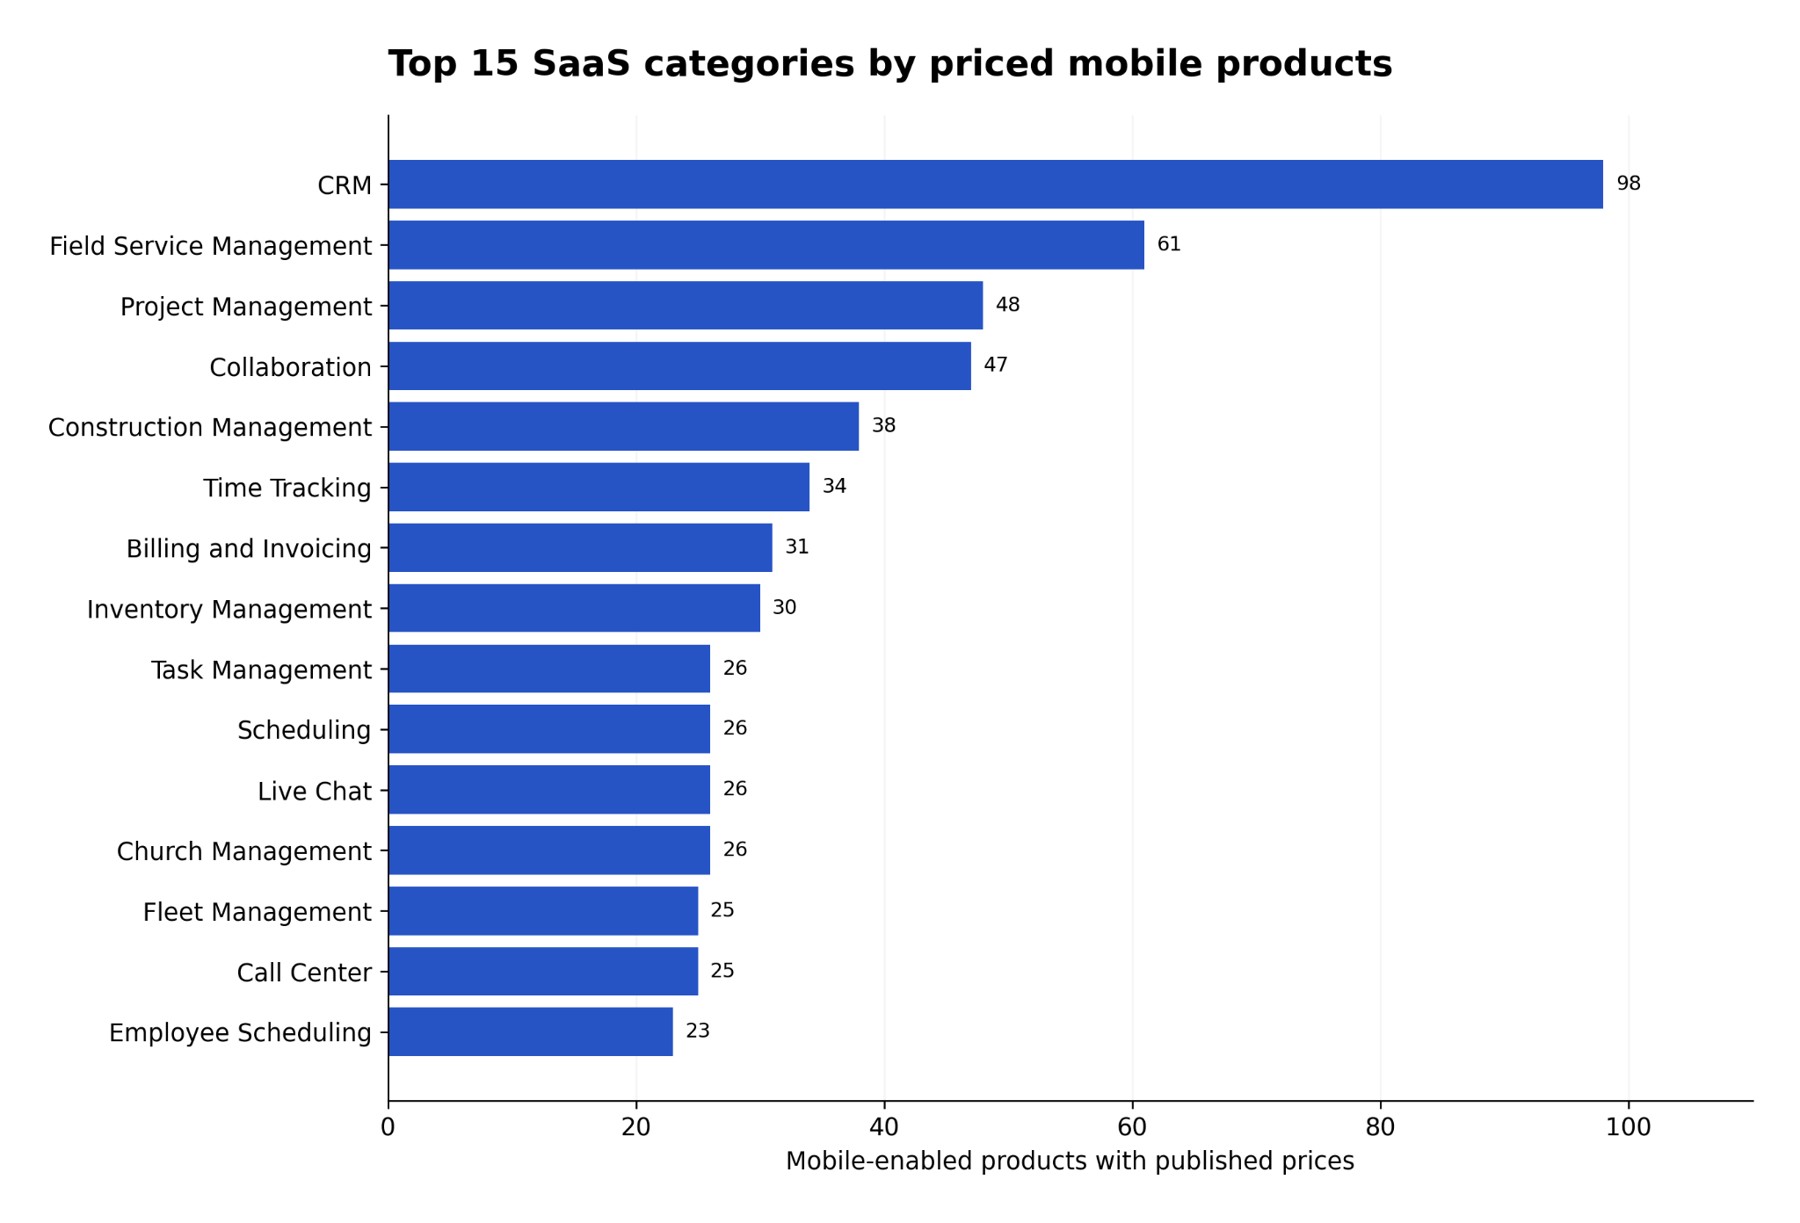
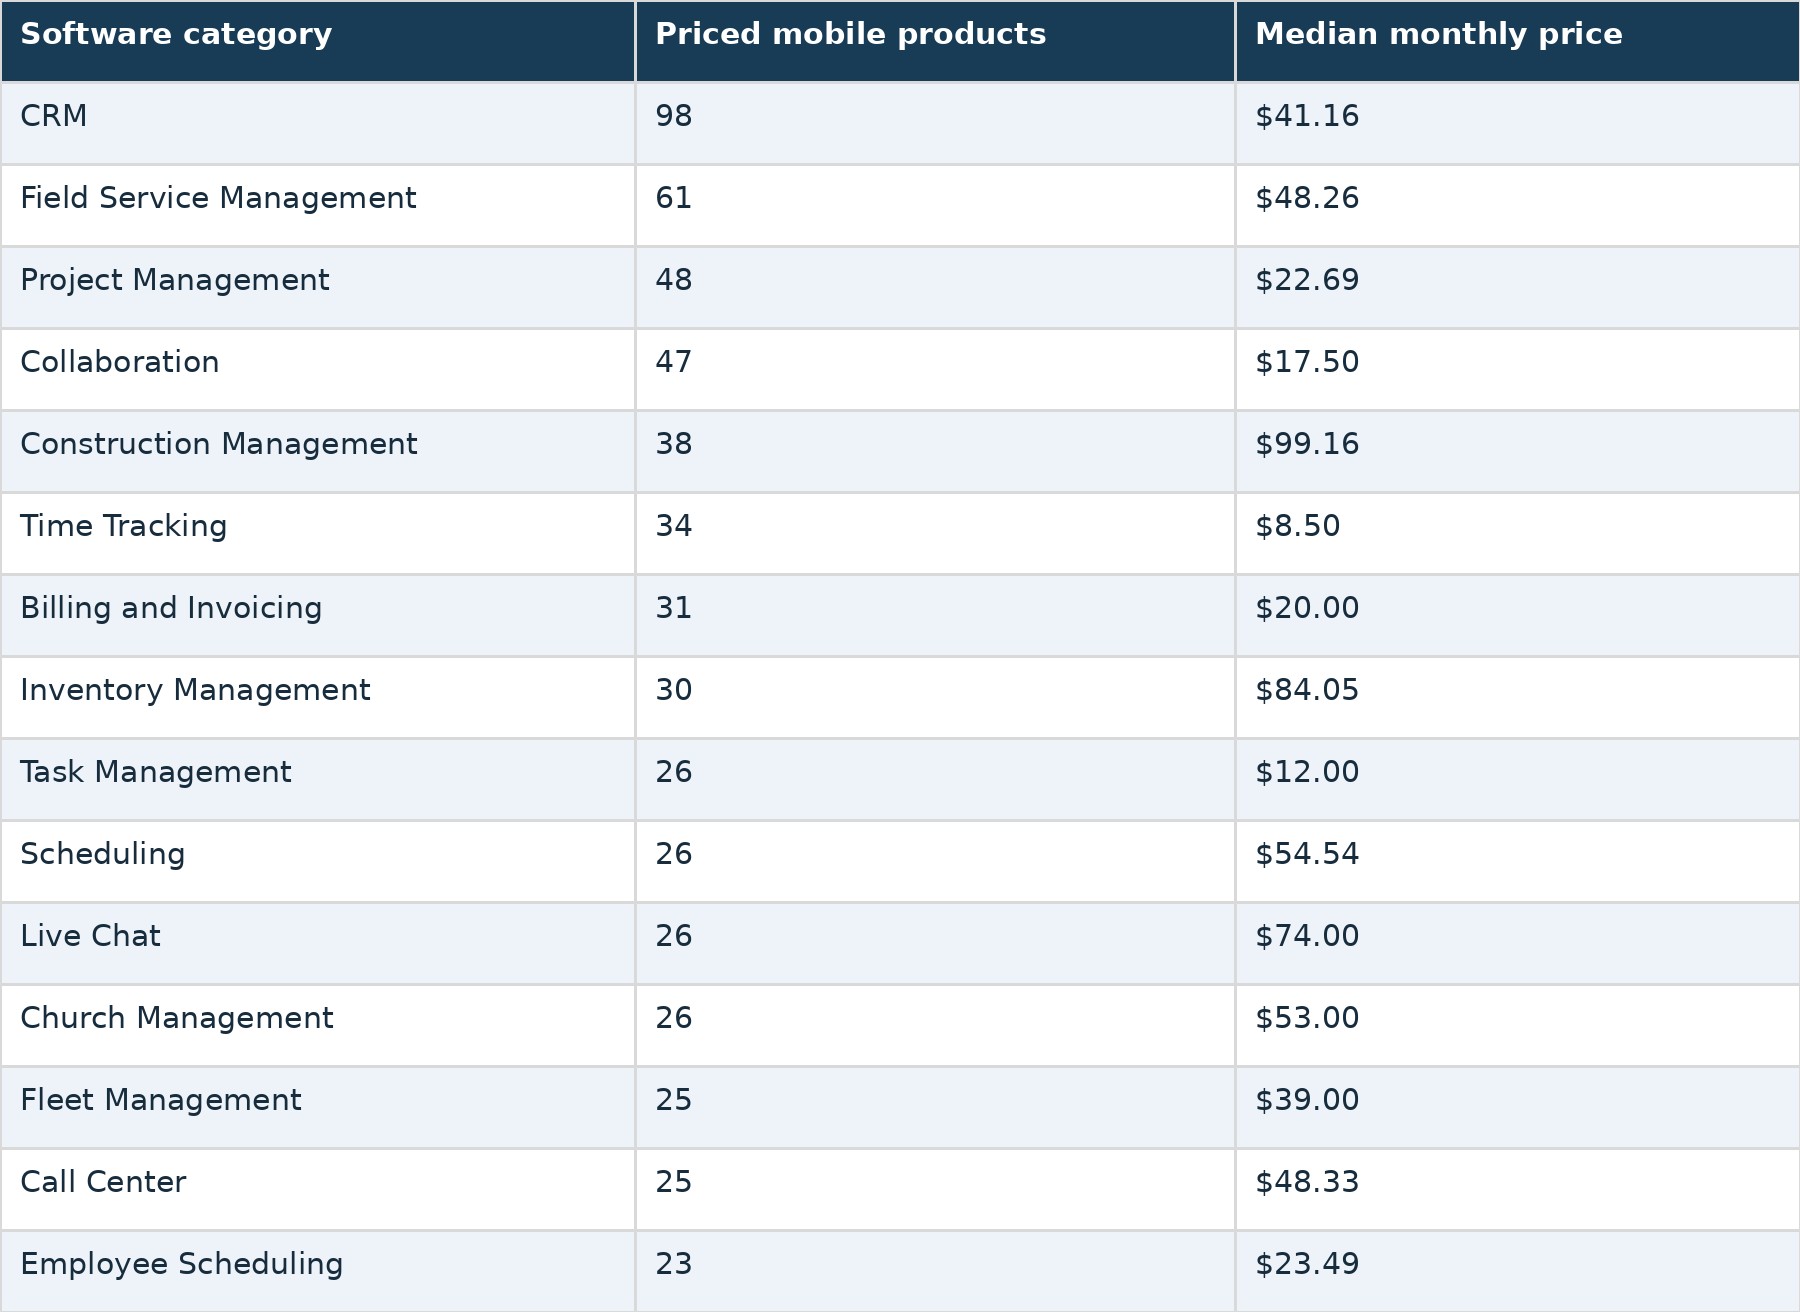
These are counts of mobile-enabled products with published prices, not every mobile-enabled product in each category. The category medians also vary substantially. Time Tracking has the lowest median among these 15 categories, at $8.50 per month, while Construction Management has the highest, at $99.16. The rankings show where priced mobile-enabled listings are concentrated, but they do not measure the percentage of all products in each category that support mobile.
Do Some SaaS Categories Favor Android Over iOS?
The report also compares the number of products supporting each mobile platform within software categories. Field Service Management has 61 products with Android apps and 56 with iOS apps. CRM has 95 Android-supporting products versus 91 supporting iOS. Task Management has 26 Android-supporting products and 23 supporting iOS. Other categories lean slightly toward iOS.
Project Management has 47 iOS-supporting products versus 45 supporting Android. Collaboration has 46 versus 44, and Inventory Management has 30 versus 28. These differences are small—between one and five products in the categories highlighted by the report. The platform counts also overlap because products supporting both platforms appear in both columns. Consequently, these differences should not be interpreted as strong evidence of category-wide preferences for one mobile operating system.
Does SaaS Mobile App Availability Change With Price?
The report examines mobile coverage across eight monthly price bands, using 13,701 products with recorded average monthly prices. The highest mobile coverage appears in the lowest price band. Among products priced below $25 per month, 19.4% have a recorded mobile app. The proportion generally declines as prices rise, although the pattern is not perfectly consistent.
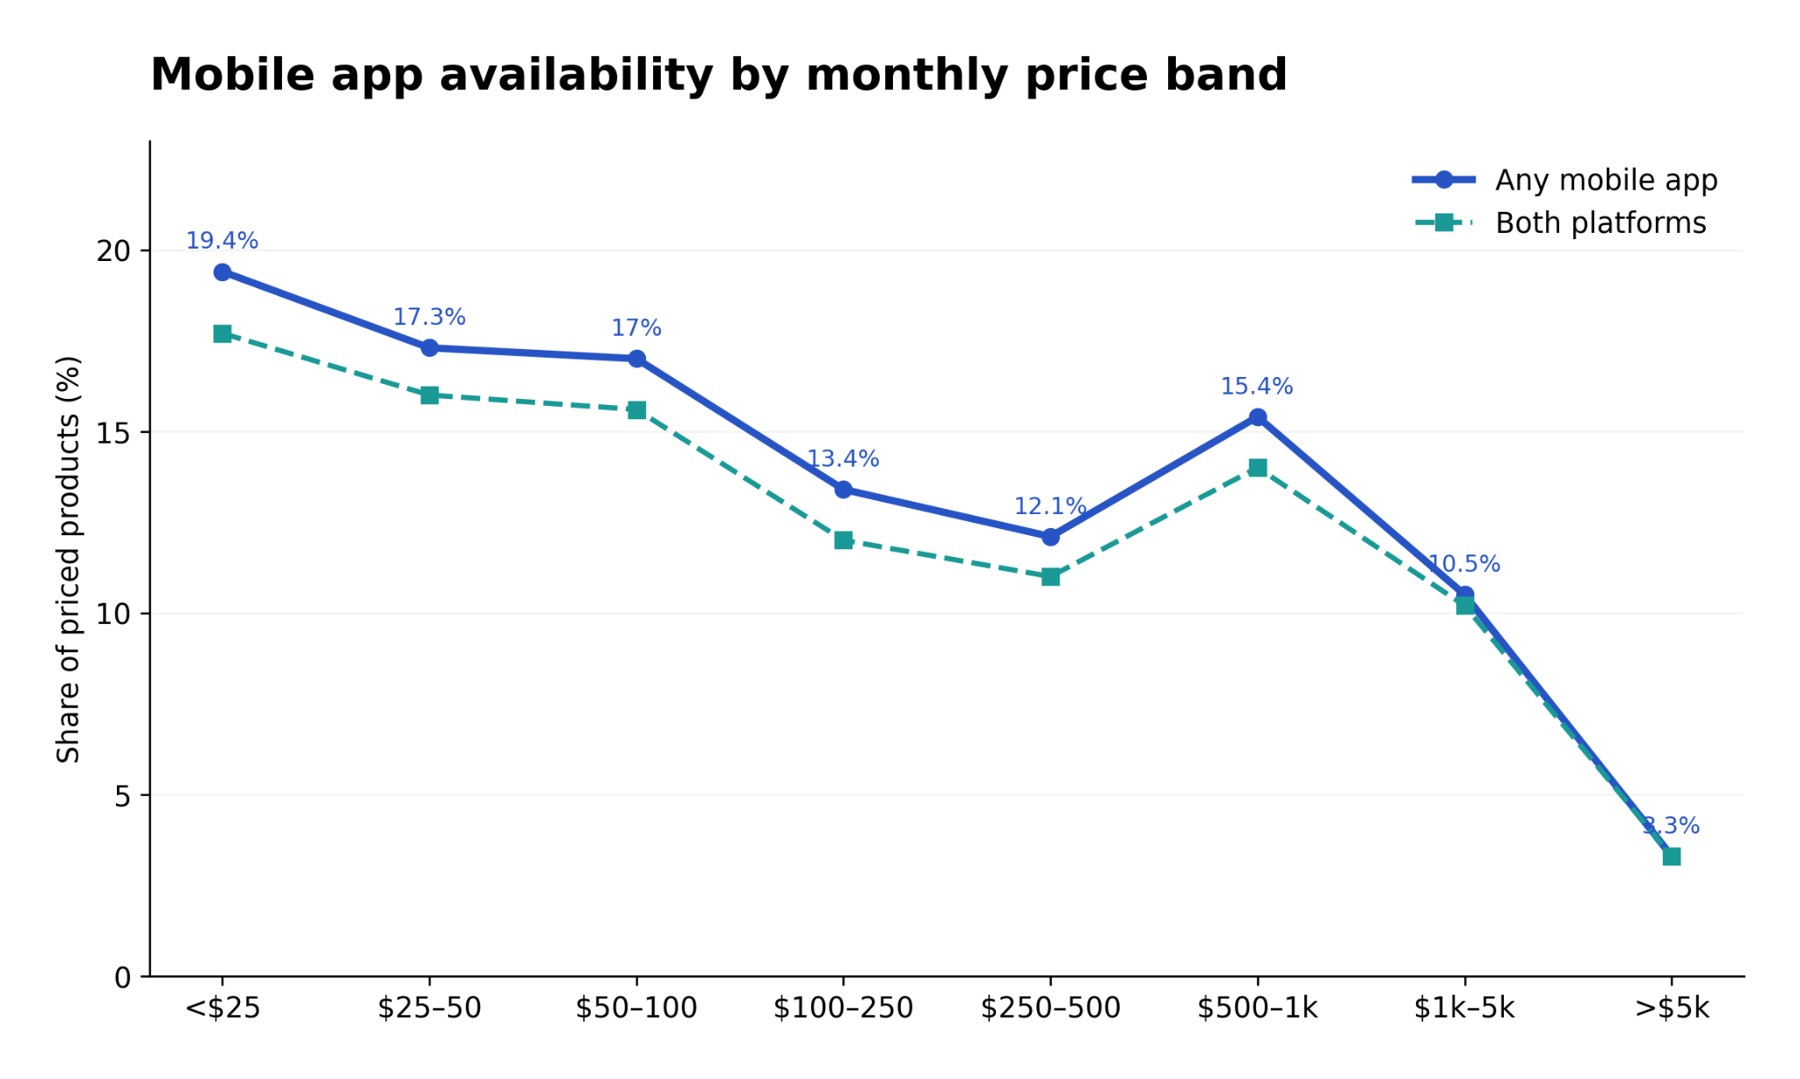
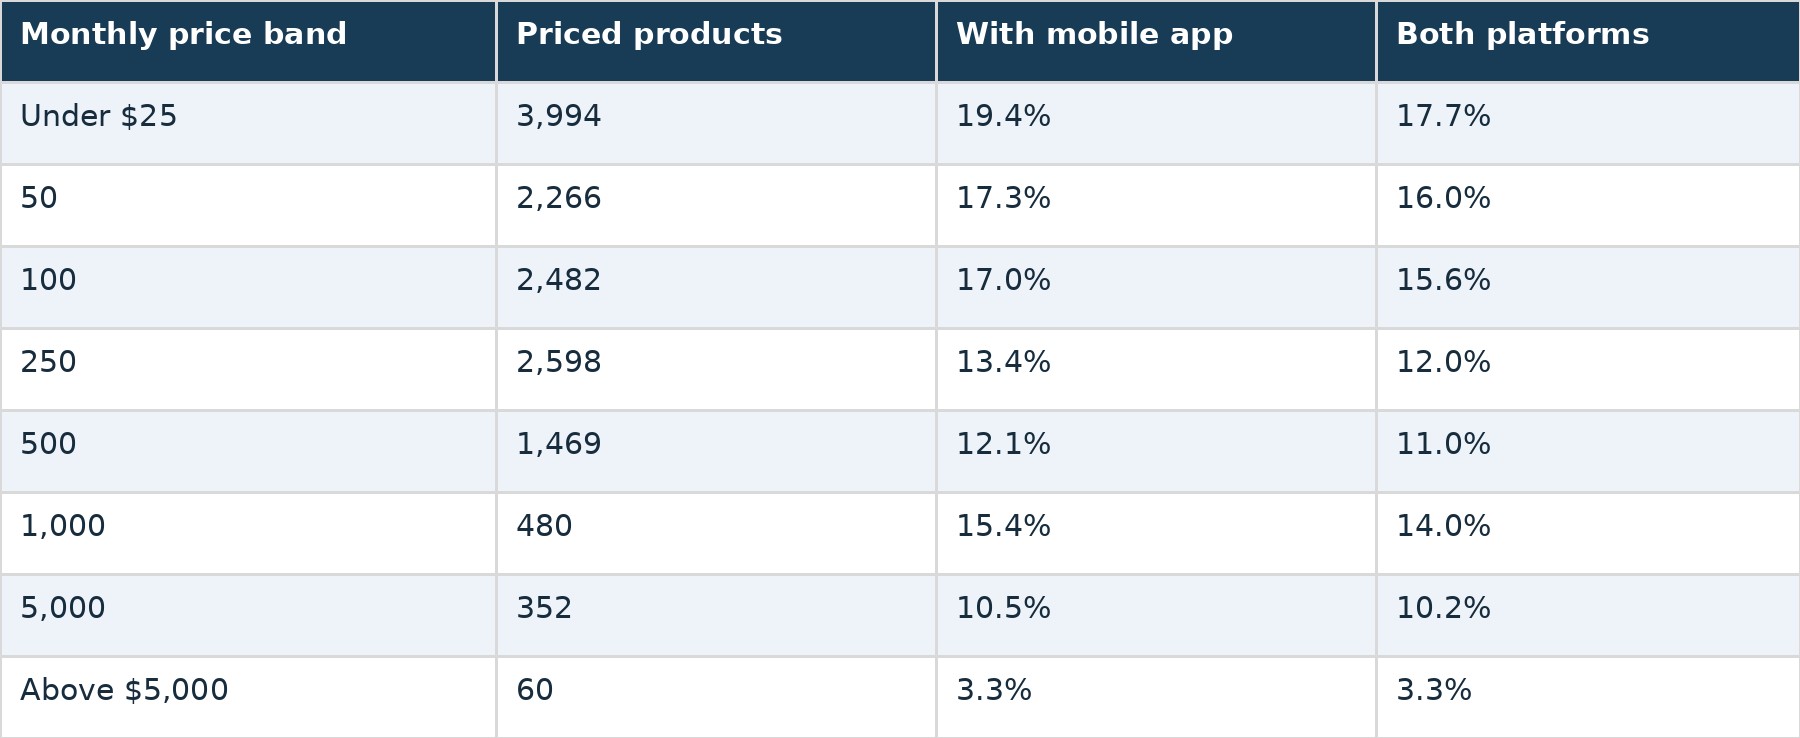
Coverage falls from 19.4% below $25 to 12.1% in the 500 range. It then rises to 15.4% in the 1,000 band before declining again. At prices above $5,000 per month, just two of 60 products have recorded mobile apps. The price-band analysis is descriptive. It does not demonstrate that lower prices make mobile app availability more likely or that higher-priced software has less need for mobile access. The higher-priced bands also contain fewer products, making their percentages more sensitive to individual observations.
What Do the Findings Mean for SaaS Buyers and Vendors?
First, mobile availability is incompletely documented. Almost half of the directory has unknown mobile-deployment status, limiting conclusions about the overall SaaS market. Second, dual-platform support dominates among confirmed mobile-enabled products. Nearly nine in ten support both iOS and Android. Third, mobile availability and pricing are associated in the dataset, but the relationships are not straightforward. iOS-only products have higher recorded prices than Android-only products, while products supporting both platforms have lower average prices than those recorded as having no mobile app.
For buyers, mobile support should be evaluated at the product level, including required features, offline capabilities, device compatibility, and security requirements. For vendors and analysts, the research provides useful directory benchmarks but does not establish the commercial value of developing an iOS or Android app.
Methodology and Data Limitations
This research is based on Solevant's SaaS mobile-availability dataset, covering 101,868 software directory listings. Products are classified into five groups using their recorded iOS and Android deployment flags: both platforms, iOS only, Android only, no mobile app, and unknown. Pricing comparisons use average monthly prices in USD and include only products with published prices. The platform pricing analysis includes 101 iOS-only and 90 Android-only priced products.
The category ranking covers mobile-enabled products with published prices, while the price-band analysis covers 13,701 priced products. Several limitations apply: Mobile-deployment information is missing for 49.48% of the catalog. A recorded mobile app indicates availability, not feature completeness or quality. Pricing comparisons are not controlled for software category, customer size, or product capabilities. The iOS-only and Android-only priced samples are relatively small.
Some price bands contain far fewer products than others. The report does not provide a data collection period or update frequency. Product-level mobile app performance, customer usage, and mobile revenue are not measured. The findings therefore describe mobile availability and pricing within Solevant's supplied directory, not the current worldwide share of SaaS products with mobile apps.
Frequently Asked Questions
What percentage of SaaS products have mobile apps?
Solevant's dataset identifies 6,880 mobile-enabled products among 101,868 listings, equivalent to 6.75%. However, mobile-deployment information is missing for almost half the catalog.
Do most mobile SaaS products support both iOS and Android?
Yes. Of the 6,880 products with recorded mobile apps, 6,121—approximately 89%—support both platforms.
Are iOS-only SaaS products more expensive than Android-only products?
Within the priced single-platform sample, the iOS-only median is $54 per month versus $35.03 for Android-only products, a difference of approximately 54%.
Which SaaS category has the most mobile-enabled products?
CRM leads the report's priced mobile-product ranking with 98 products, followed by Field Service Management with 61 and Project Management with 48.
Are products without mobile apps more expensive?
In this dataset, products recorded as having no mobile app have a higher mean and median listed price than products supporting both platforms. This does not establish that mobile availability causes the difference.
Does mobile availability decline as SaaS prices rise?
The report shows a generally declining pattern across price bands, from 19.4% below $25 per month to 3.3% above $5,000, with a rebound in the 1,000 band.
Does support for both platforms mean the apps have identical features?
No. The dataset records whether iOS and Android apps exist, not whether their features or performance are equivalent.
Conclusion
Solevant's analysis of 101,868 SaaS listings shows that confirmed mobile-app availability is relatively uncommon in the directory, although missing deployment information prevents a definitive market-wide estimate. Among products with recorded mobile apps, supporting both iOS and Android is overwhelmingly the norm. The pricing data also reveals differences between iOS-only, Android-only, dual-platform, and no-mobile products, while category and price-band comparisons show that mobile availability is not evenly distributed. For SaaS buyers, vendors, and researchers, the findings offer a useful starting point for understanding mobile support—but they also show why product-level verification and complete deployment data matter.