

US Tech Events vs Global Trends: 614 Events, Formats and Topic Rankings Analyzed
In Solevant's Events Index snapshot, 131 of 614 tracked events are associated with the US, representing 21.3% of the unfiltered event count. Data is the most common topic in both views, but the US places DevOps second rather than fourth, and its format records lean more heavily toward in-person participation. The differences are useful for planning event guides, topic roundups and localized editorial coverage. They are not a census of all technology conferences, proof that one topic is growing, or a measure of attendance. The dashboard counts unique event entries, format records and topic tags on different bases. Understanding those denominators is essential to interpreting the numbers accurately.
Key findings at a glance
- The global, unfiltered dashboard contains 614 events; applying Country = US returns 131 events, or 21.3% of the baseline.
- The format chart contains 1,279 records globally but only 150 in the US, equal to 11.7% of the baseline's format records. Format records are not unique events.
- In-person accounts for 70.7% of US format records (106 of 150), versus 66.1% globally, a difference of 4.6 percentage points.
- Online accounts for 29.3% of US format records (44 of 150), compared with 33.9% globally. The source provides global percentages, not exact global counts by format.
- Data leads both topic rankings, with 289 tags globally and 39 in the US. JavaScript is third in both, with 151 and 18, respectively.
- DevOps ranks second in the US versus fourth globally. General moves from second globally to fourth in the US; Python ranks seventh in the US versus tenth globally.
How many tech events are in the US compared with the global index?
The unfiltered index returns 614 event entries. The US-only filter returns 131, leaving 483 events outside the US filter. The US therefore represents 131 ÷ 614 = 21.3% of the tracked event records in this particular dataset.

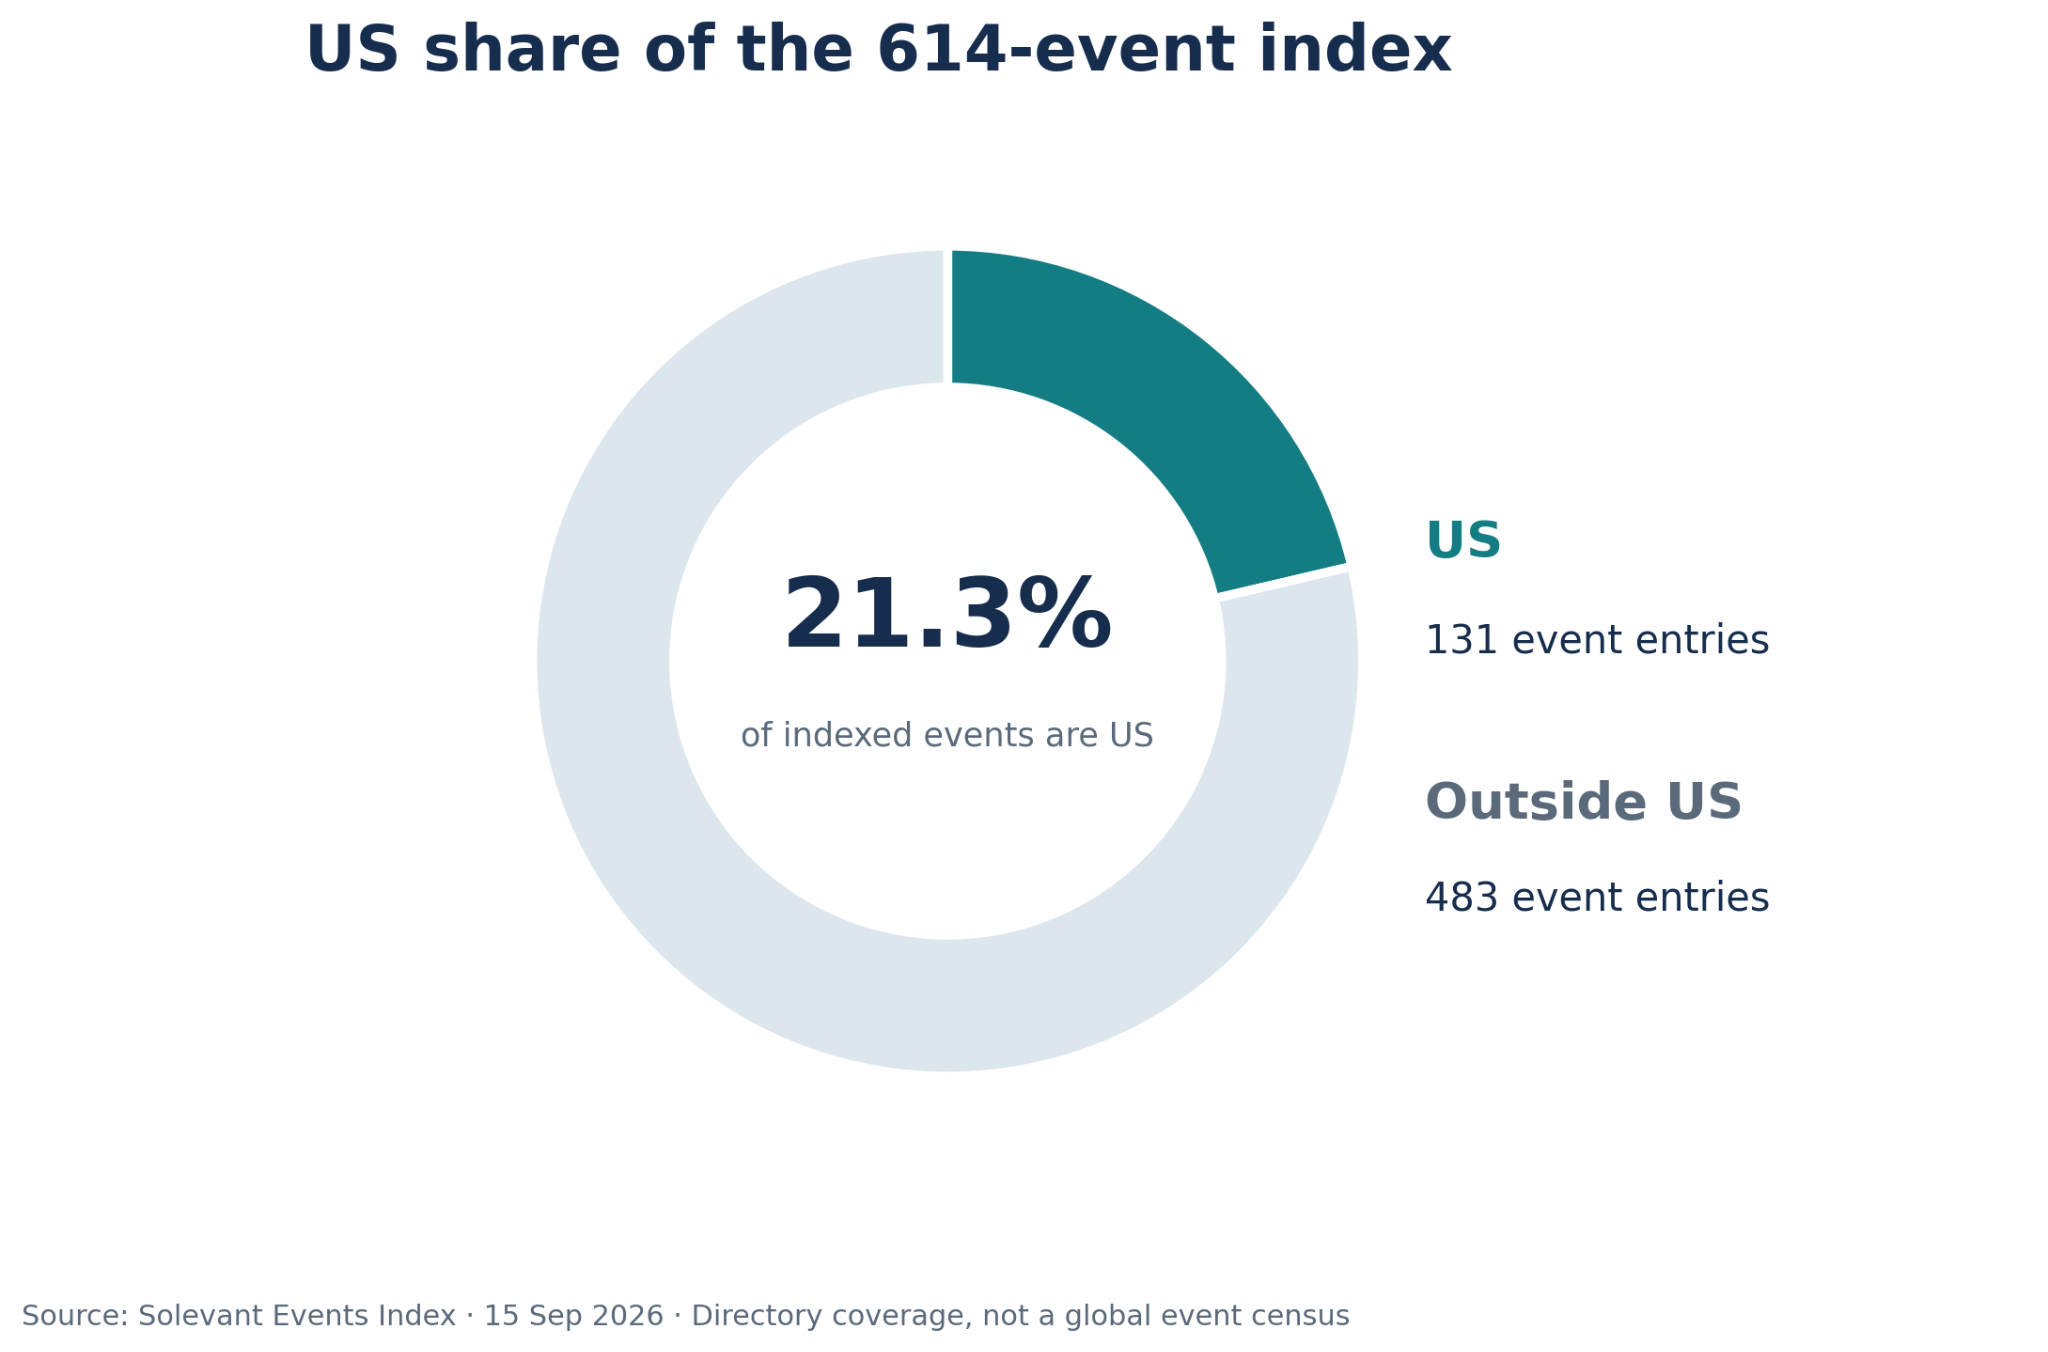
That makes the US a substantial component of this directory and a practical candidate for localized editorial coverage. But the share is coverage within Solevant's index, not a verified estimate of the US share of all real-world technology events. The report does not disclose its collection methodology, missing-country rates, city coverage or criteria for adding events. The dashboard was captured on 15 September 2026. It provides a snapshot rather than a historical series, so the 131-event count cannot show whether US event activity increased or decreased from an earlier year.
Why does the US have 21.3% of events but only 11.7% of format records?
A crucial distinction in the source is that the format chart does not use the same counting unit as the headline event card. Across the full index, the format visualization totals 1,279 records even though there are only 614 events. In the US view, the corresponding figures are 150 format records and 131 events.
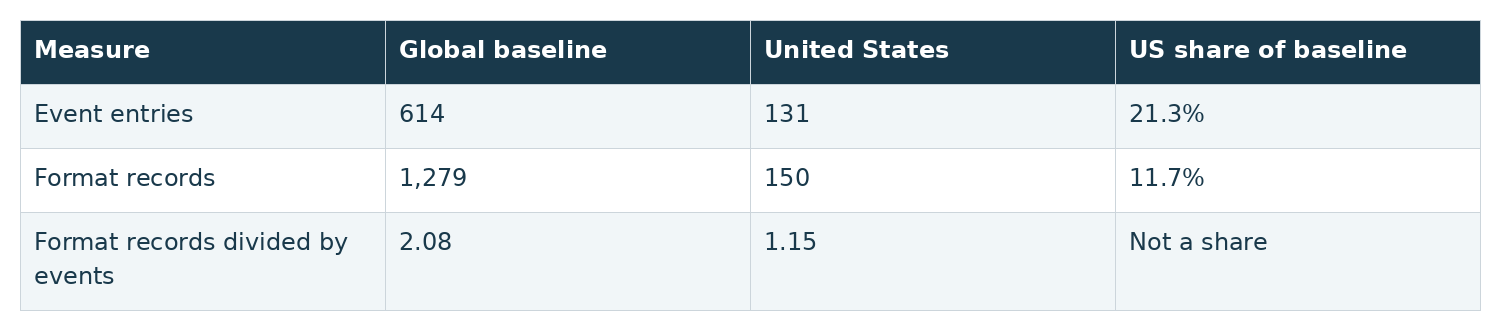
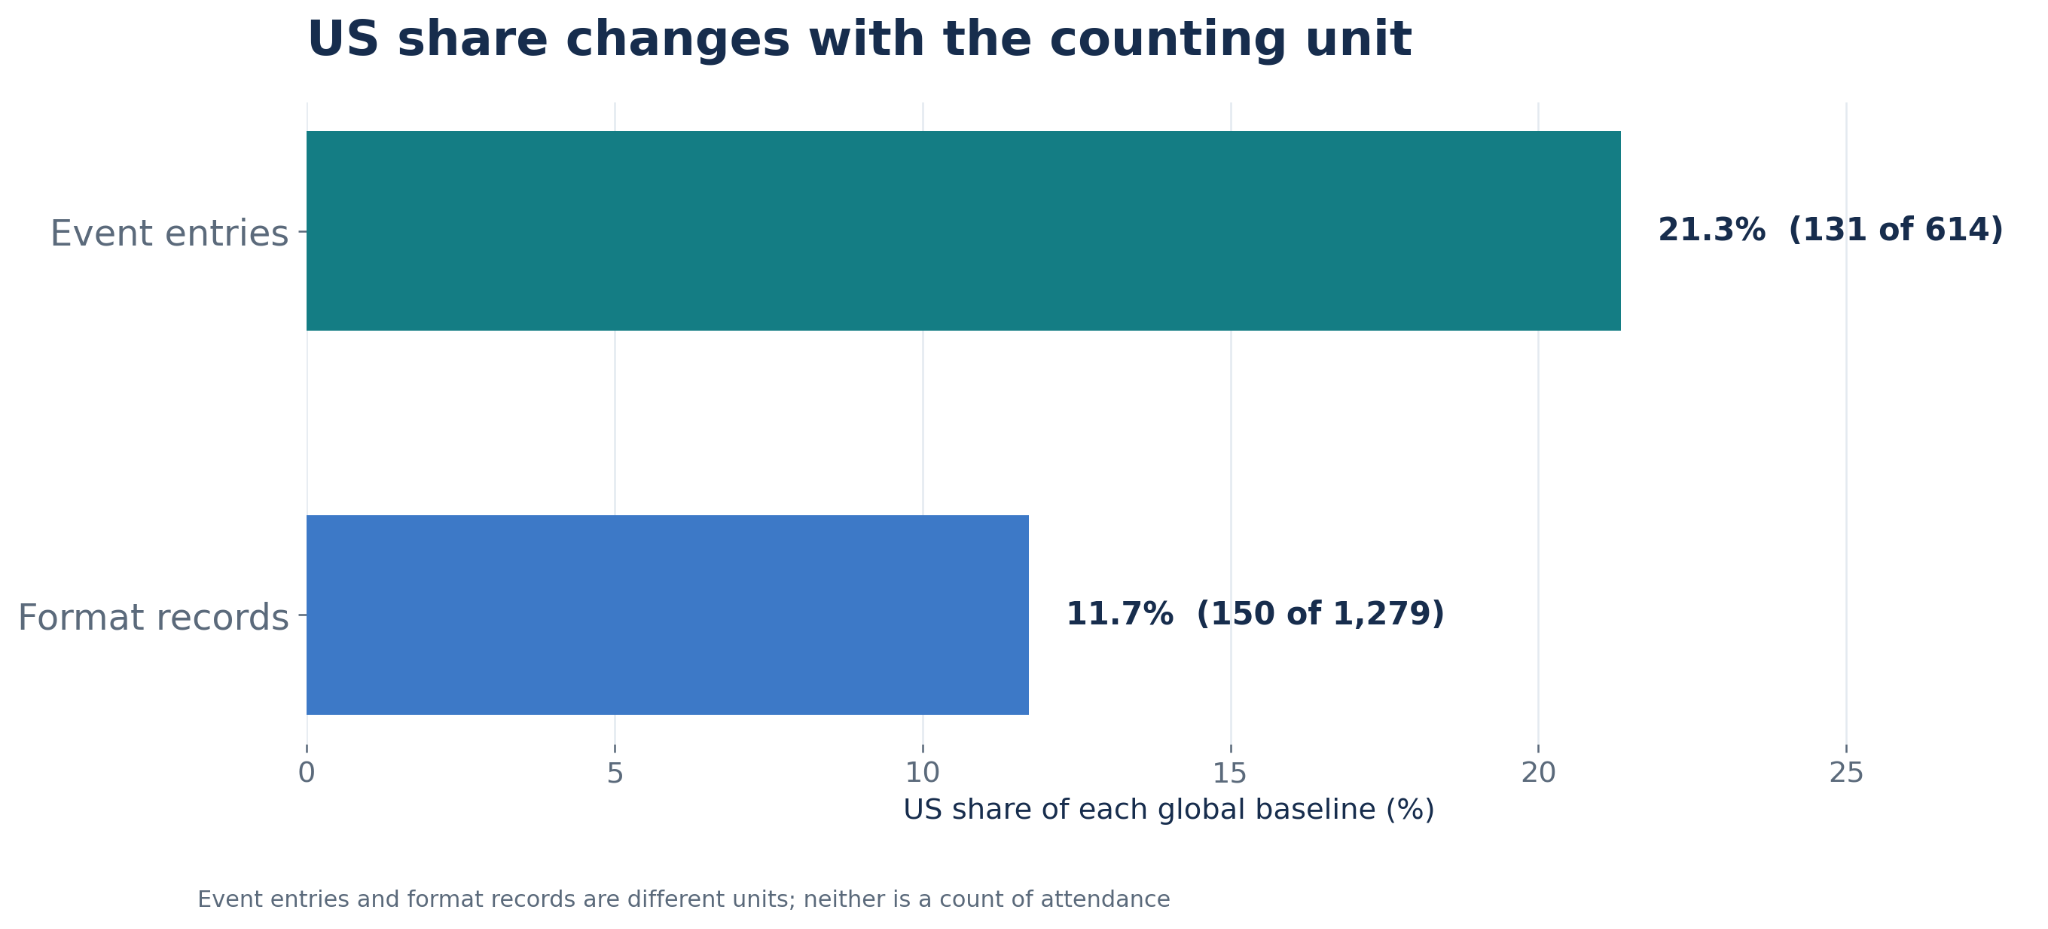
The report explains that events may have multiple format records and topic tags. It does not establish exactly why the global format-record count is so much larger than the event count, or whether every event has at least one format record. A plausible explanation is that some events carry multiple format classifications, but the source does not supply record-level evidence to confirm the pattern. Format records and event entries must be interpreted separately. Summing topic tags or format classifications does not produce a new count of unique conferences or meetups.
Are US tech events more likely to be in person?
The US format records have a higher in-person share, although the dataset does not support an event-level probability claim. In the US, 106 of 150 format records (70.7%) are labeled in-person, and 44 (29.3%) are online. Globally, the corresponding proportions are 66.1% in-person and 33.9% online.
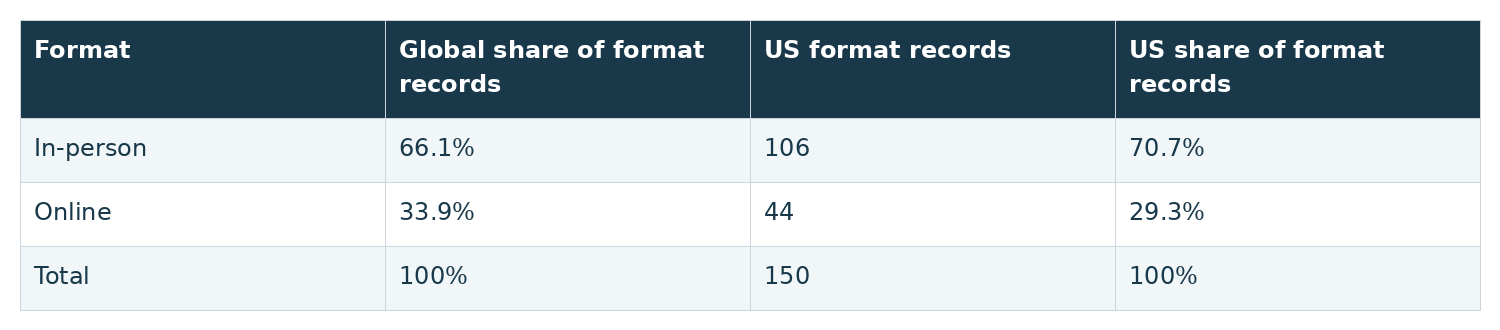
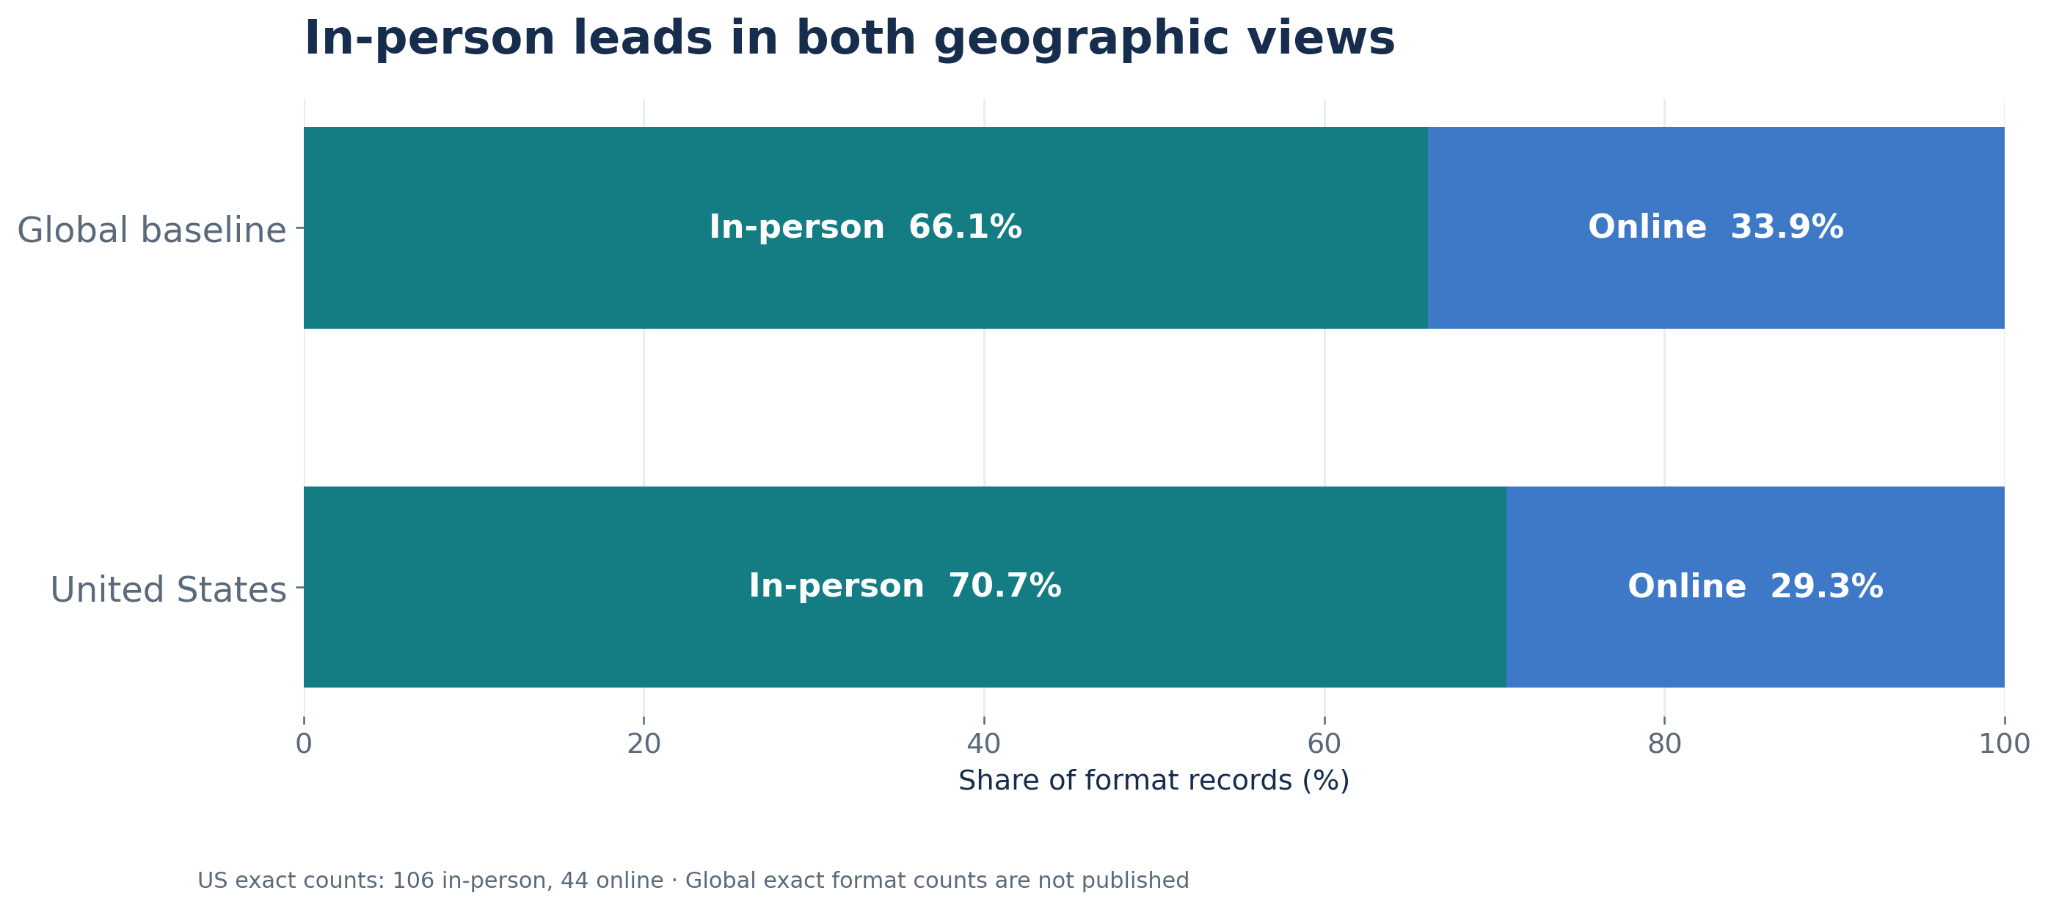
The US in-person share is 4.6 percentage points higher than the baseline, while its online share is 4.6 points lower. This supports an editorial emphasis on in-person event guides for US readers, including location, travel, tickets and practical planning information. It does not establish that 70.7% of unique US events are exclusively in-person, because the format visualization counts records rather than deduplicated events. Online formats remain important. Nearly three in ten US format records and roughly one in three global format records are online. A global guide to virtual conferences, workshops and meetups can therefore complement city-focused US content. The snapshot does not provide ticket sales, attendance, event duration or audience preference data, so it cannot demonstrate which format is more popular with participants.
How many format records are attached to each event entry?
Dividing the format-record totals by the headline event totals produces a simple descriptive ratio: 1,279 ÷ 614 = 2.08 format records per event globally, versus 150 ÷ 131 = 1.15 in the US.
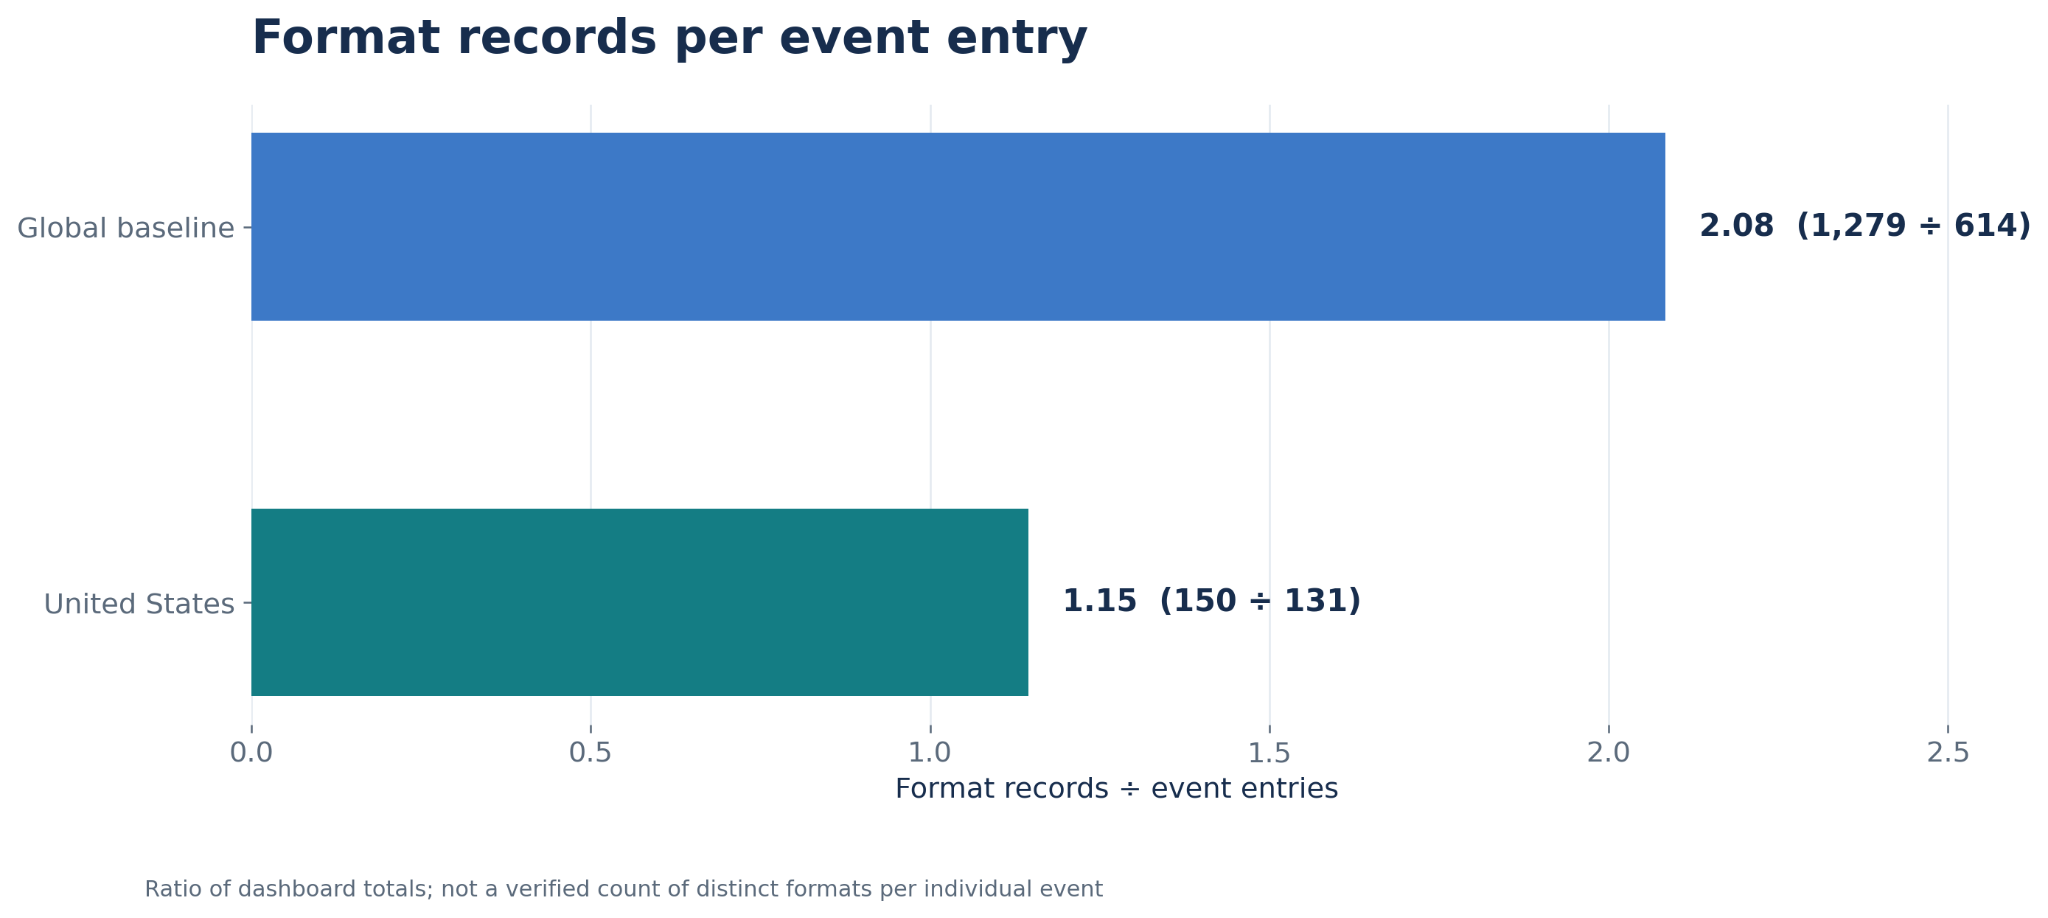
The global ratio is approximately 1.8 times the US ratio. That is a meaningful difference in how the dashboard's records are represented, but not proof that non-US events are more frequently hybrid. The source does not show event-level joins, duplicate rules, or whether a format record can repeat within an event. For future data releases, a deduplicated event-by-format export would answer more useful questions: how many events are exclusively in-person, exclusively online, or tagged with both formats? The current briefing does not supply those counts.
Which technology topics are most common globally and in the US?
Data ranks first in both views. The global topic chart shows 289 Data tags, while the US view shows 39. JavaScript is third in both rankings, with 151 tags globally and 18 in the US. The source also provides comparable counts for PHP and Networking.
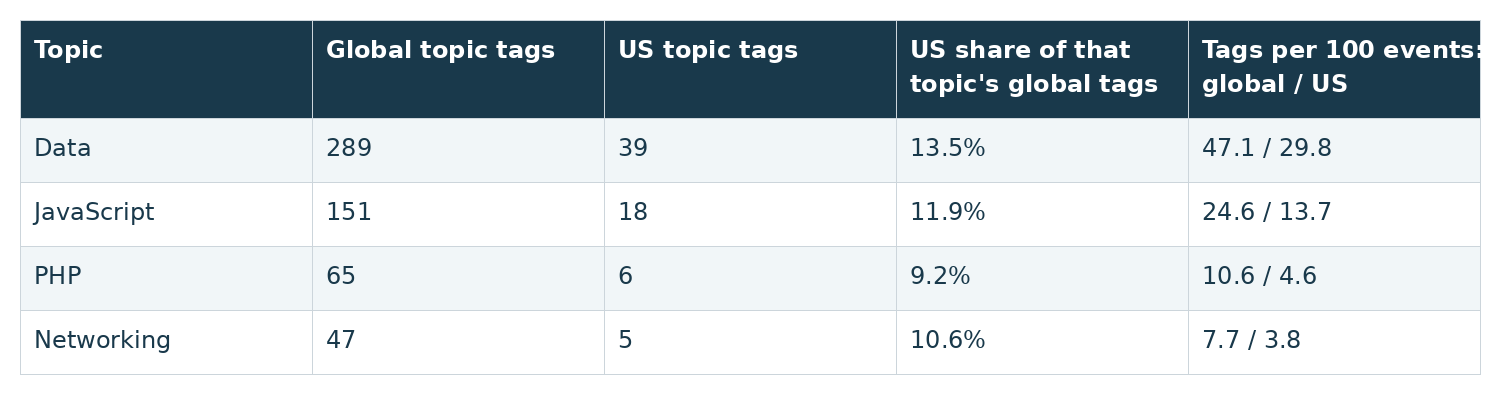
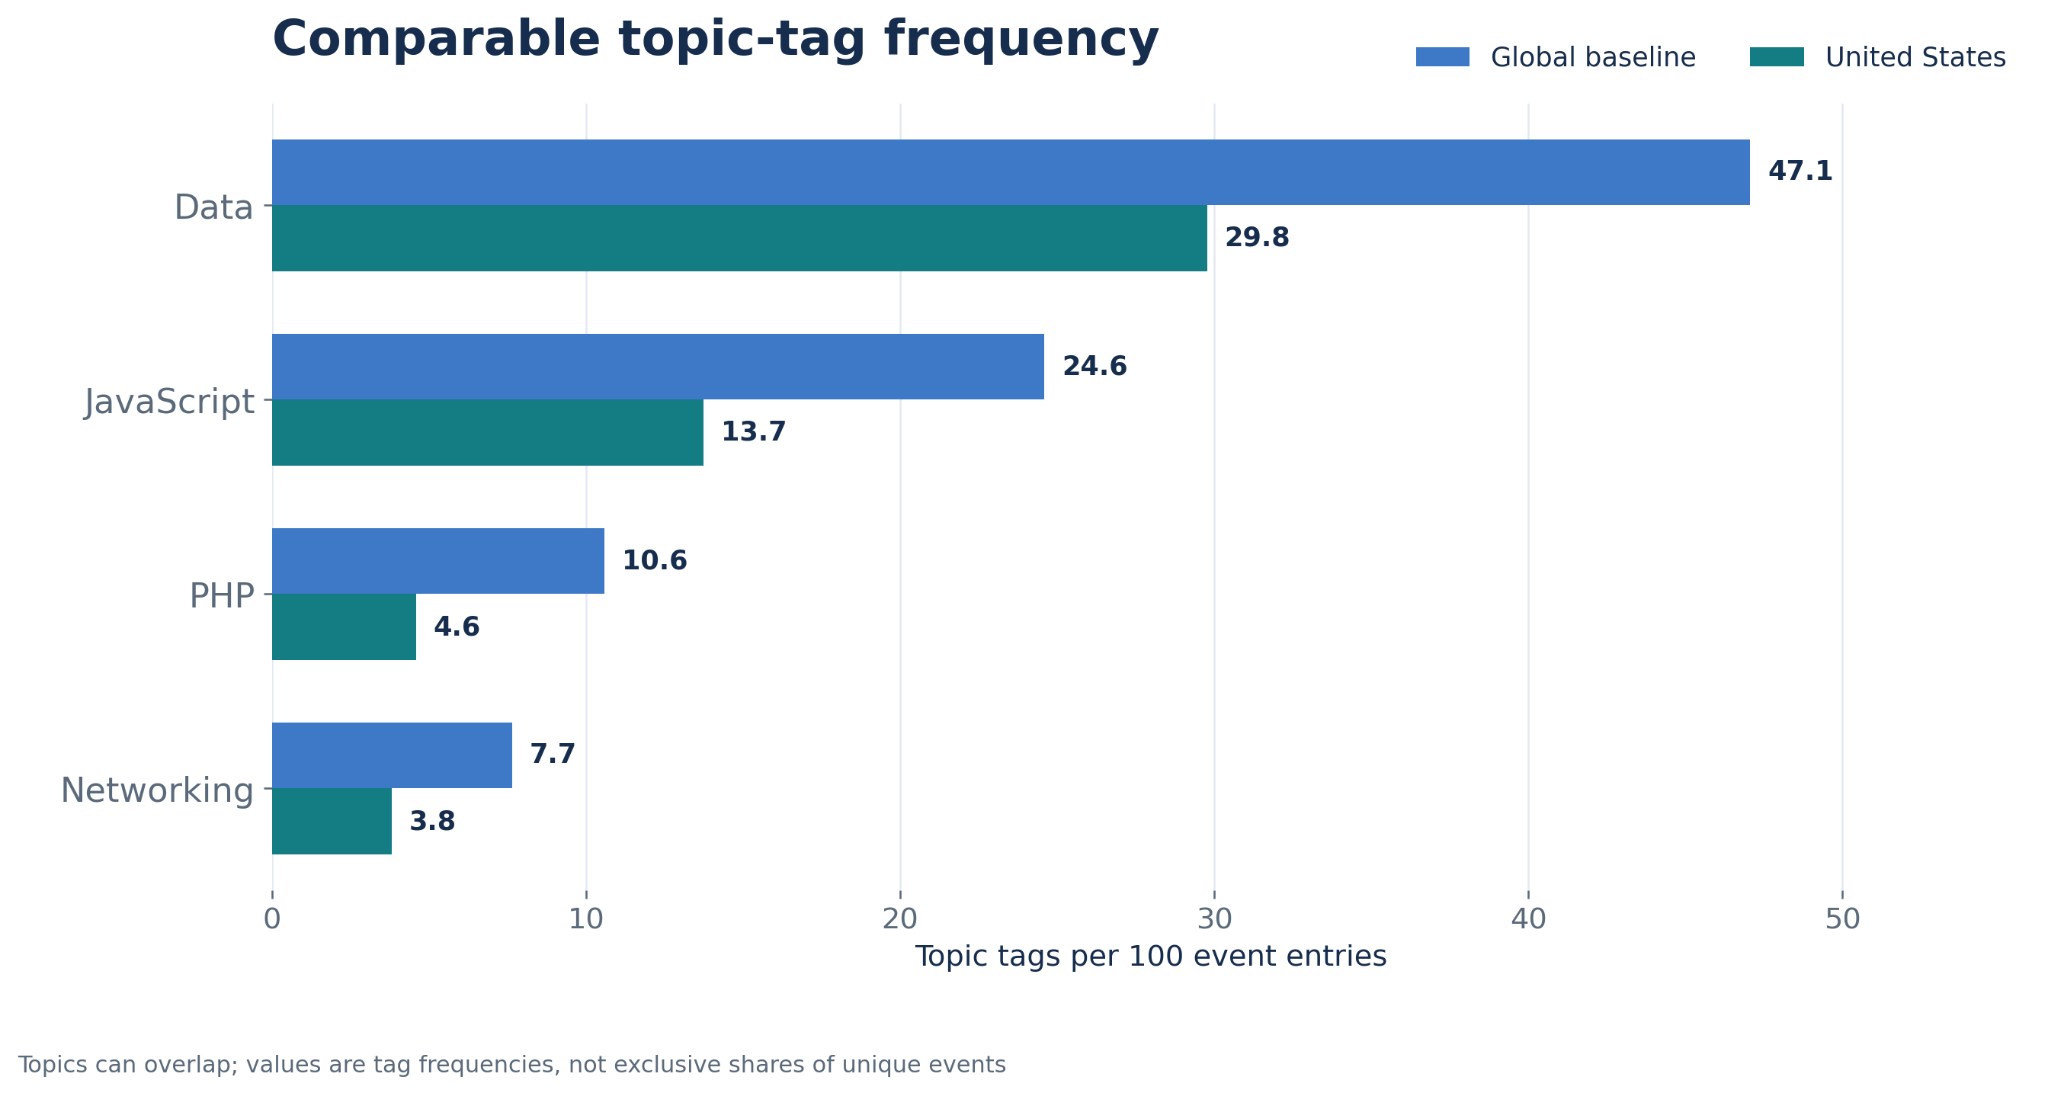
The “tags per 100 events” measure divides a topic's tag count by the number of event entries in the same view. For example, Data's 289 ÷ 614 × 100 = 47.1 globally and 39 ÷ 131 × 100 = 29.8 in the US. This is a normalization of tag frequency, not an exclusive category breakdown or a claim that each event has exactly one topic. The US holds 21.3% of event entries, but only 13.5% of global Data tags, 11.9% of JavaScript tags, 9.2% of PHP tags and 10.6% of Networking tags. All four published comparable topics therefore under-index relative to the US event-entry share. That pattern may reflect differences in tag assignment, topic breadth or directory coverage; the report does not identify a cause. It should not be used to claim that US audiences have less interest in those subjects.
How do the topic rankings change in the United States?
The report's clearest topic-specific finding is a difference in rank order, not a trend over time. Data stays first and JavaScript stays third. DevOps ranks fourth globally but second in the US; General shifts from second globally to fourth in the US. Python ranks seventh in the US compared with tenth globally, while Security is tenth in the US compared with sixth globally.
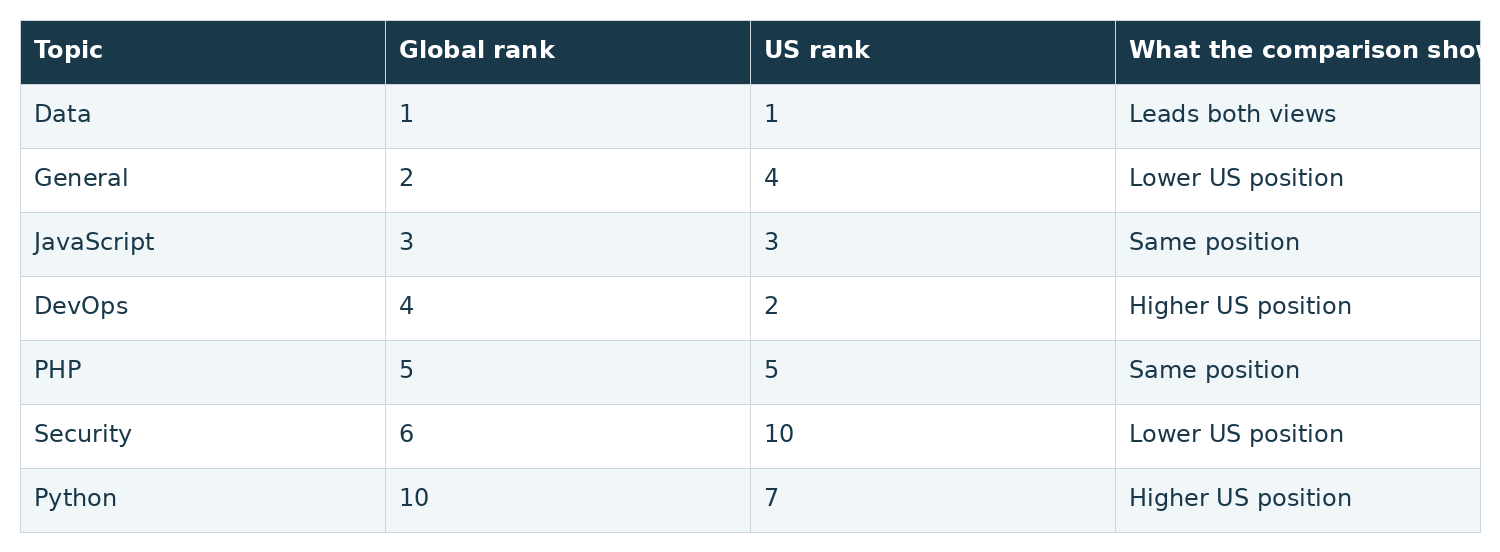
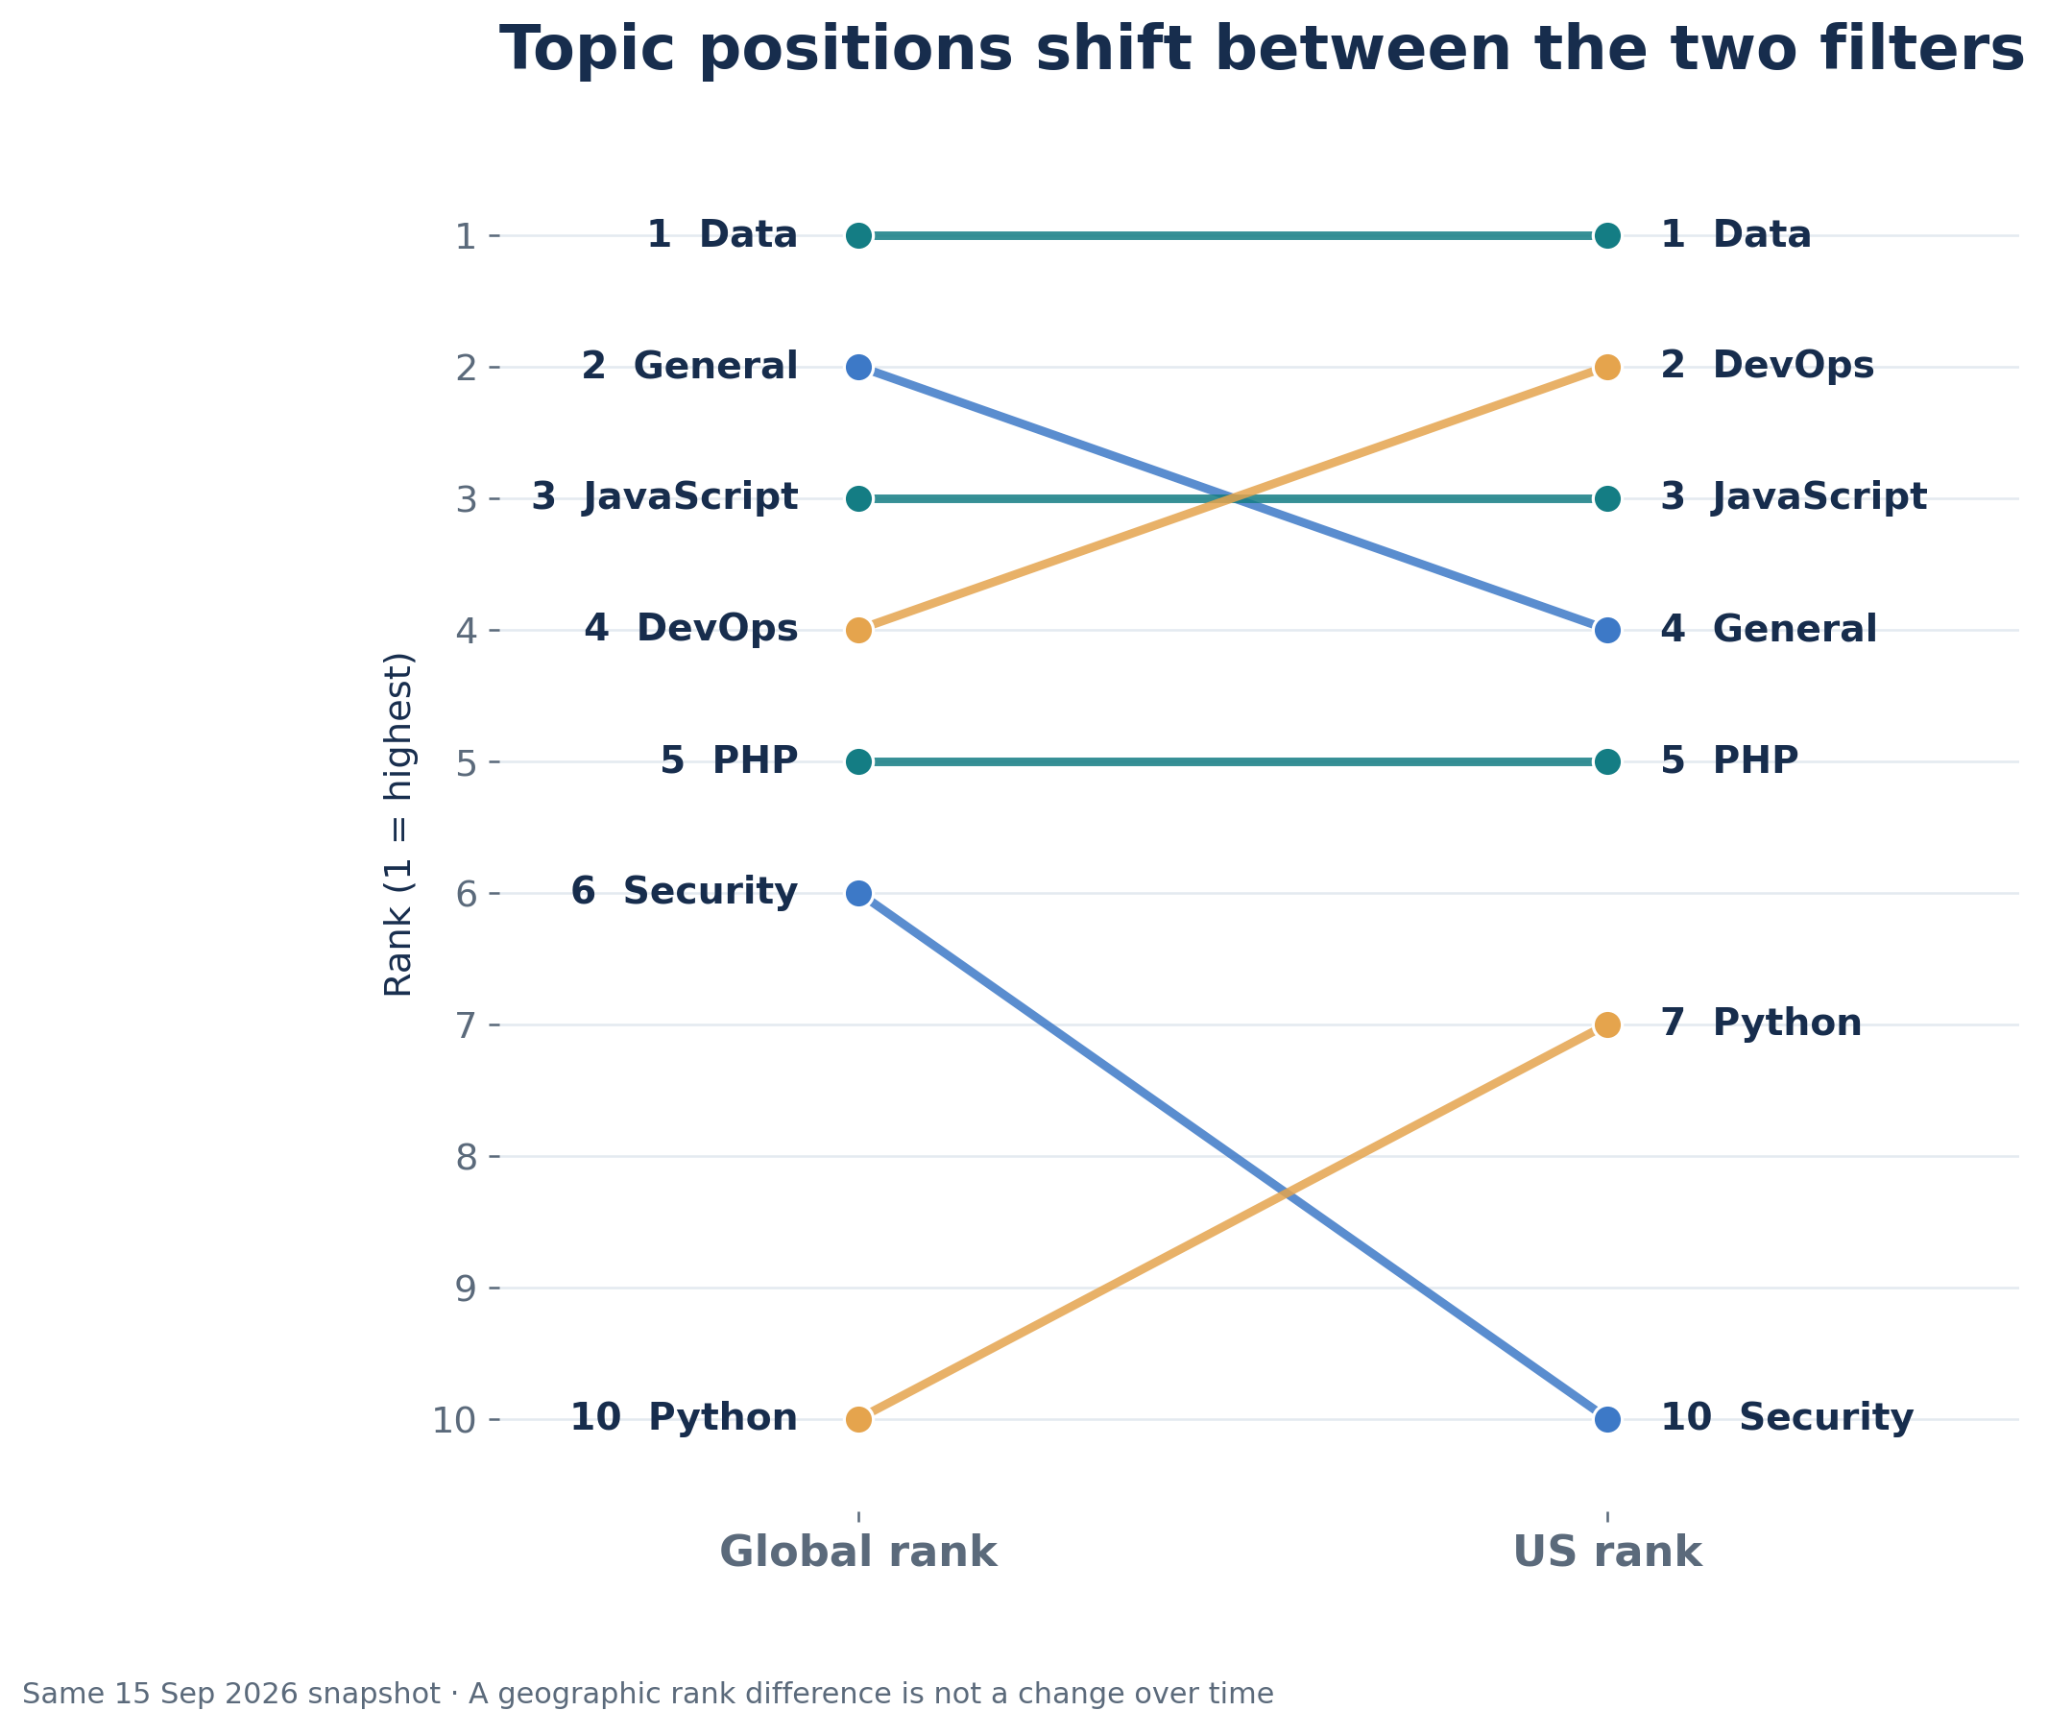
The source notes that Python and PHP each have six US topic entries, despite appearing in different rank positions. That is a reminder that rank ordering may include ties and other categories not shown in this table. The dashboard leaves some bars without printed values, so this article does not invent counts for DevOps, General or Security. The useful editorial interpretation is straightforward: a US-specific DevOps events guide has a stronger relative ranking than it does in the global list, while Data and JavaScript can support shared global and US content frameworks. The fact that Security ranks tenth in the US does not establish that cybersecurity events are declining; no historical observations are included.
How should these figures be used responsibly?
The counting units differ throughout this comparison: 614 and 131 are event entries; 1,279 and 150 are format records; 289 and 39 are Data topic tags. A single event may contribute multiple records or tags, so adding topic totals does not yield the number of distinct events. Rank differences are geographic comparisons within one snapshot, not time trends. Security’s sixth-place global rank and tenth-place US rank cannot demonstrate a fall in event activity. The same limitation applies to claims that DevOps or Python is growing in the US.
Finally, do not turn this snapshot into a current calendar. The dashboard was captured 15 September 2026, but the report does not list event dates, attendance, cities, ticket availability, venues or an exhaustive sampling methodology. Those details require a separate, dated event-level source.
Methodology and limitations
Source and observation date: Solevant, Events Index, based on a dashboard captured on 15 September 2026. The baseline has no country filter; the comparison applies the US country filter. Event counts: The unfiltered card reports 614 events and the US card 131. The remaining 483 is the arithmetic difference, not an independently published country breakdown. The directory's completeness and event deduplication rules are not documented. Format counts: The unfiltered format chart totals 1,279 records, and the US chart 150. The source provides exact US counts of 106 in-person and 44 online, but only global percentages of 66.1% and 33.9%. Exact global format counts have not been inferred from rounded percentages.
Topic counts and rankings: Events can have multiple topic tags. The four comparable topics with printed counts are Data (289/39), JavaScript (151/18), PHP (65/6) and Networking (47/5), shown as baseline/US. Python has six US entries according to the briefing. Other topic bars are partly unlabeled, so exact counts for DevOps, General and Security are not supplied here. Rank positions come from the report's reading of the charts. Interpretation: All comparisons describe one index snapshot. They do not establish market share of all real-world tech events, audience demand, attendance, format preference, causation or year-over-year changes.
Frequently asked questions
How many US tech events are in Solevant's Events Index?
The US filter returns 131 events, or 21.3% of the 614 entries in the unfiltered dashboard captured on 15 September 2026.
Are most US technology events in person?
70.7% of the US format records are in-person (106 of 150), compared with 66.1% globally. Because format records are not unique event counts, this is not necessarily the share of distinct US events held exclusively in person.
What share of the index's format records comes from the US?
150 of 1,279, or 11.7%. That differs from the 21.3% event-entry share because the two visualizations count different units.
What is the most common technology-event topic?
Data ranks first globally and in the US, with 289 global tags and 39 US tags in the published comparison.
Is DevOps more popular in the US than globally?
The report places DevOps second in the US and fourth globally. That is a relative ranking difference in the directory, not a direct measure of audience popularity or growth.
Are cybersecurity events declining in the United States?
The report does not establish a decline. Security ranks tenth in the US versus sixth globally, but the dashboard shows only one snapshot, not historical changes.
Why are there more format records than events?
The global format chart totals 1,279 records against 614 event entries. The briefing notes that events may carry multiple classifications, but it does not supply the record-level relationships needed to explain every extra record.
Conclusion
Solevant's September 2026 Events Index snapshot places 131 of 614 tracked events (21.3%) in the United States. US format records are 70.7% in-person, versus 66.1% globally, while Data remains the leading topic in both views and DevOps ranks notably higher in the US. The essential qualification is that events, format records and topic tags have different denominators. The report supports a careful comparison of directory composition and rankings—not claims about real-world event-market size, changing topic demand or the success of particular events. The snapshot does not establish current event dates, availability or schedules.
Source: Solevant, Events Index (The United States Against the Global Baseline), dashboard captured 15 September 2026.