

Clinical Trial Records in the US, UK and Canada: One in Three, Status Gaps and Sponsor Shifts
How much of Solevant's Clinical Trial Knowledge Graph is associated with the United States, United Kingdom and Canada? A combined filter for these three countries returns 207,383 records out of 591,256 in the unfiltered graph—35.1%, or slightly more than one in three. The three-country view is not simply a smaller version of the full database. Its unknown-status share is much lower (6.6% versus 15.7%), while terminated records make up a larger share (9.4% versus 5.7%). The view also contains a stronger concentration of NIH-classified lead sponsorship, and its leading named sponsors are mostly hospitals, universities and federal research institutes.
These are database-record comparisons, not a census of all clinical trials conducted in the three countries. The combined filter does not provide separate national totals or city-level results.
Key findings at a glance
- 207,383 of 591,256 records (35.1%) are returned by the combined US, UK and Canada filter.
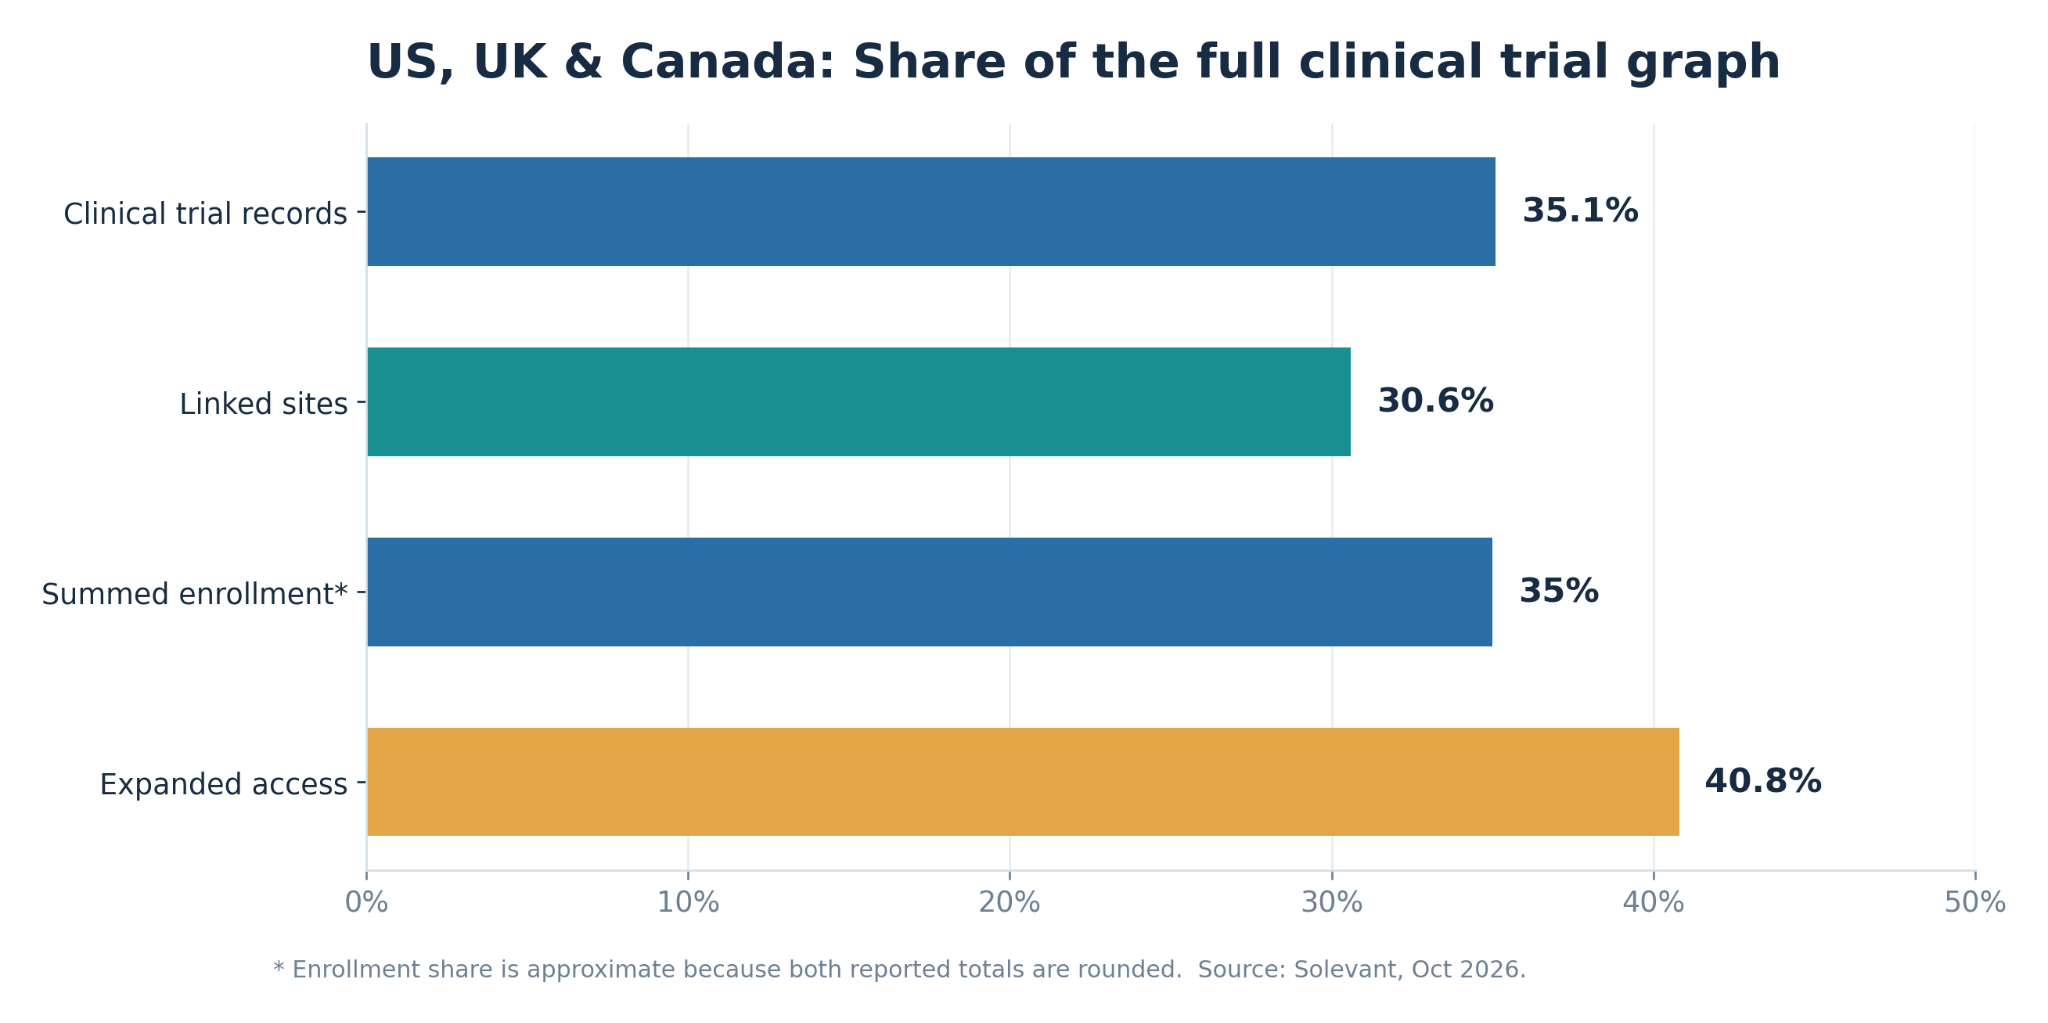
- The view contains 1,064,680 linked sites (30.6% of the baseline), around 1.1 billion in summed enrollment (about 35%) and 431 expanded-access records (40.8%).
- Interventional studies account for 81.8% of the filtered records, compared with 76.3% of the full graph.
- Unknown status falls from 15.7% to 6.6% of records; only 14.7% of the graph's unknown-status records fall within the filter.
- 57.7% of all terminated records are in the three-country view, even though the view contains just 35.1% of records overall.
- NIH-classified lead sponsors account for 9,500 records (4.6%) in the view, compared with a source-estimated baseline share of at most 2.6%.
- The National Cancer Institute (NCI) ranks first among named lead sponsors in the filtered view and has 7,350 mentions among the ten displayed collaborator groups—42.5% of those top-ten mentions, not 42.5% of all collaborations.
What share of the clinical trial knowledge graph is in the three countries?
The filtered view includes 207,383 records and 1,064,680 linked sites, compared with 591,256 records and 3,476,599 linked sites in the full graph. The corresponding shares are 35.1% and 30.6%. Summed enrollment is reported as approximately 1.1 billion in the filtered view versus 3.1 billion in the full graph, so its share is about 35%; both enrollment totals are rounded.
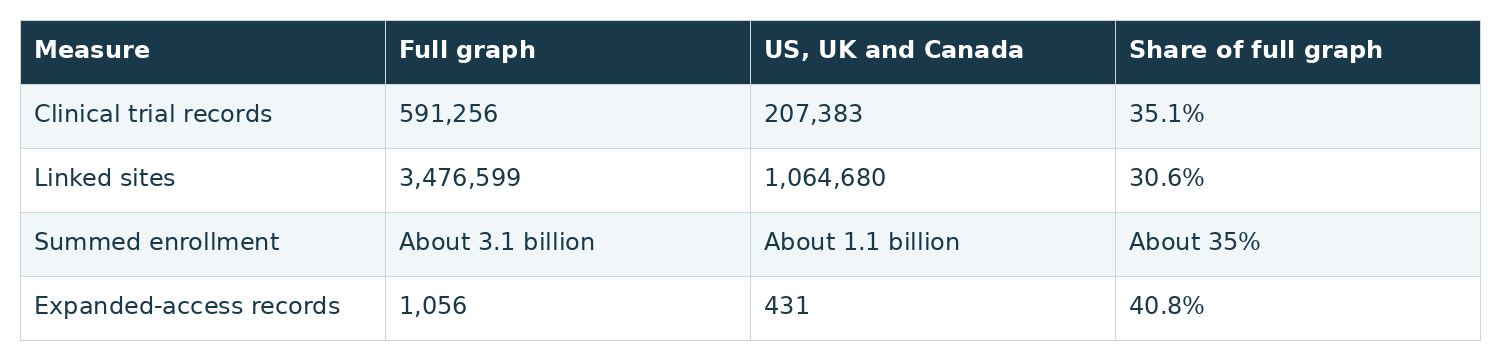
The filtered records average approximately 5.1 site links per record, compared with 5.9 in the full graph. Average summed enrollment is about 5,300 per record versus about 5,200 globally. Those enrollment averages are approximate and do not represent unique participants: the graph aggregates recorded enrollment values, and the report does not supply a median or distribution. The earlier Solevant analysis of South Africa, Ghana and Nigeria returned 1,586 records (0.27%) in the same-sized baseline. This provides context for how differently the two geographic filters are represented, but it is not a population-adjusted comparison of national research activity.
Are interventional studies more common in the filtered view?
Yes. The report's study-type charts show 169,730 interventional records in the US–UK–Canada view, or 81.8%, compared with 451,169 (76.3%) in the unfiltered graph. The filtered view also contains 37,222 observational records and 431 expanded-access records. All 207,383 filtered records have a study type, whereas the full graph contains 976 untyped records.
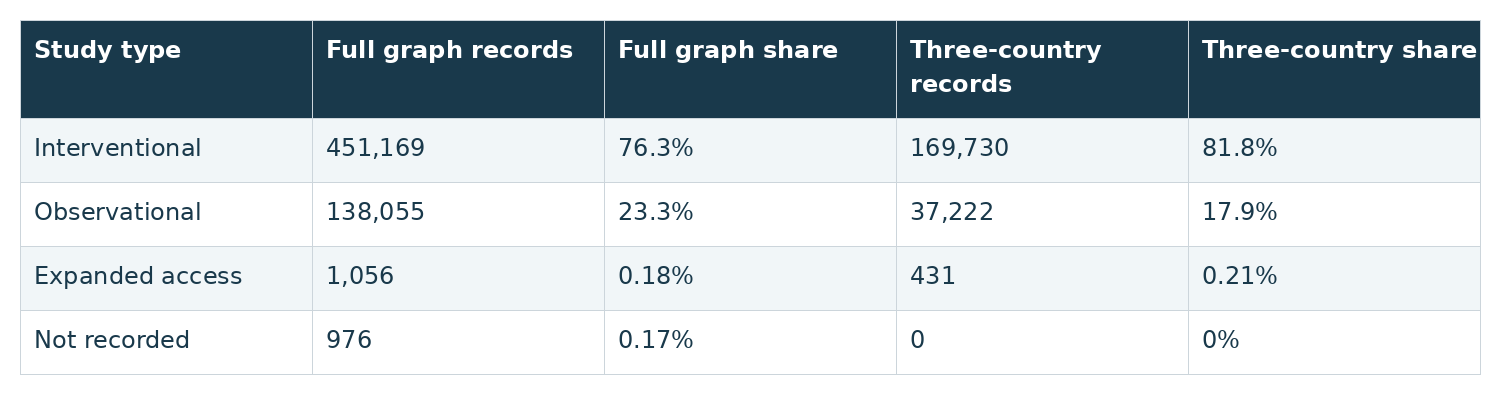
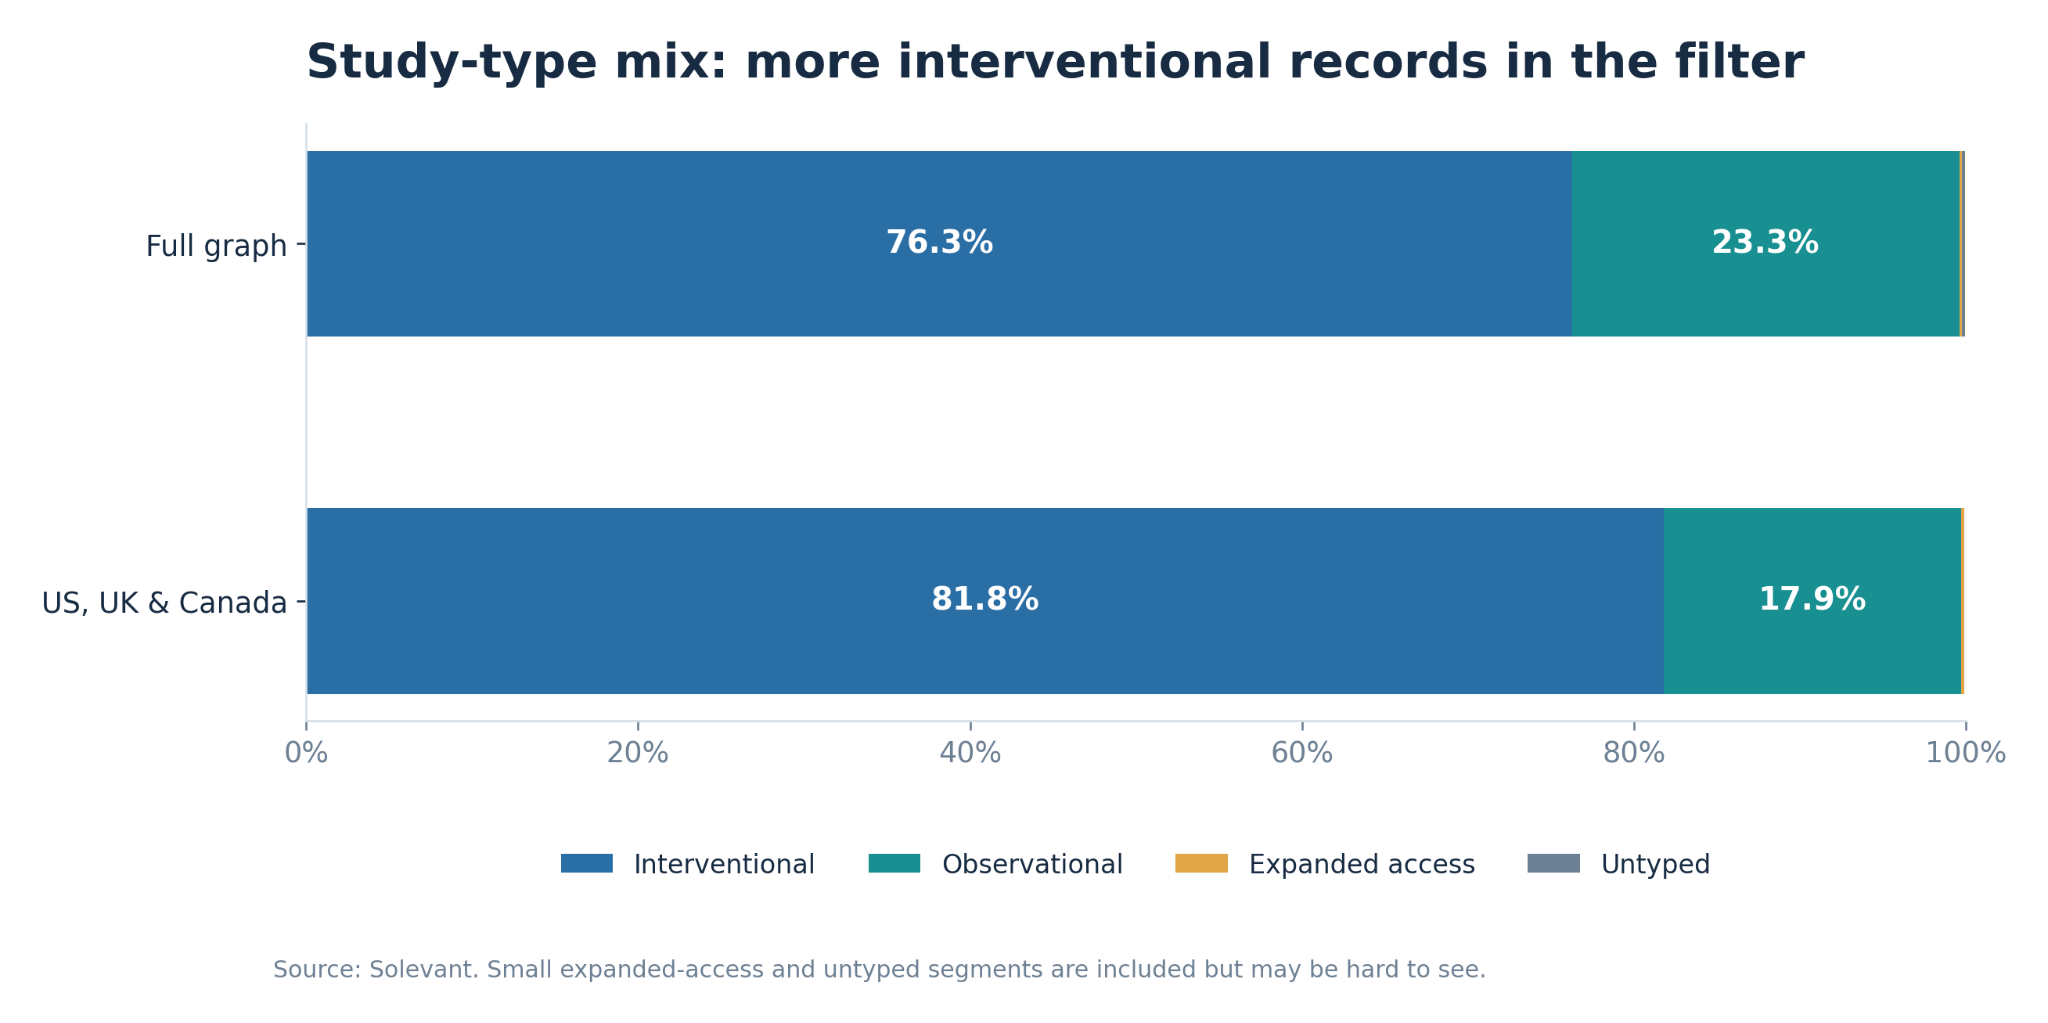
The difference is 5.5 percentage points for interventional studies. It describes the composition of records at one capture date; it does not establish a growth rate or show which of the three countries contributes most to the difference.
Why does unknown clinical trial status fall so sharply?
The report identifies unknown status as one of the strongest differences between the filtered and unfiltered views. Unknown accounts for 15.7% of all graph records but just 6.6% of the US–UK–Canada records. In contrast, completed records increase from 54.6% to 61.2%, and terminated records from 5.7% to 9.4%. Recruiting remains almost unchanged, at 11.1% versus 11.2%.
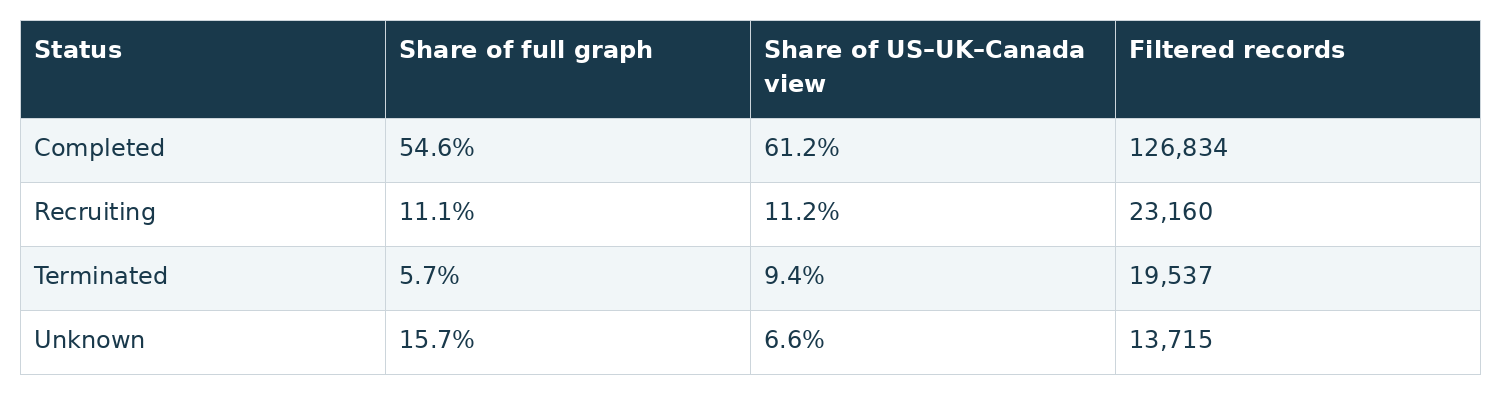
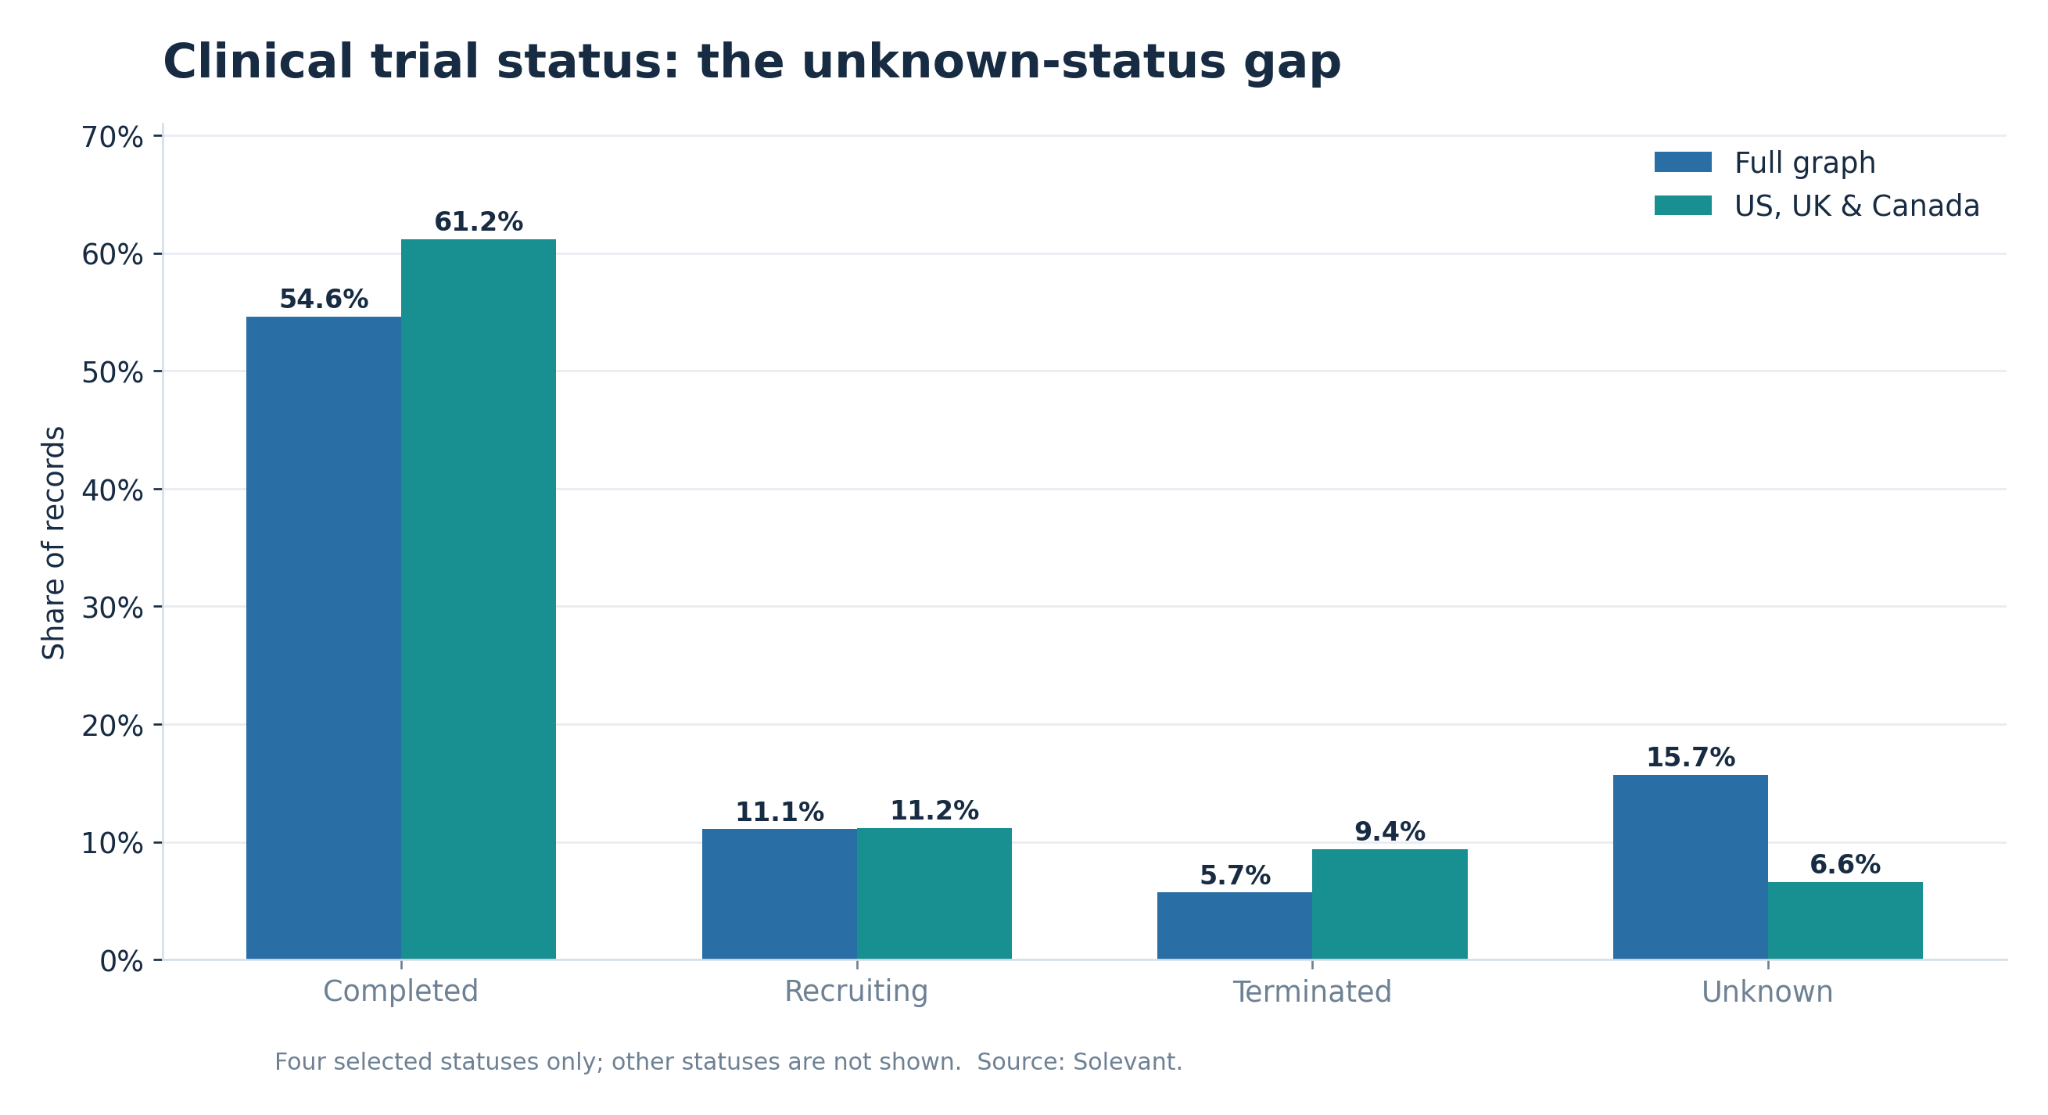
The definition of unknown status has not been verified. Registry-update practices may contribute to the pattern, but the smaller unknown-status share does not establish more reliable reporting or more consistent follow-up in these countries.
Why are terminated records disproportionately represented?
A second way to read the status data is to ask: what share of each status across the entire graph falls within the three-country filter? This is a different denominator from the percentages above. Of all terminated records in the graph, 57.7% are in the US–UK–Canada view. The corresponding figures are 39.3% for completed records, 35.4% for recruiting records and only 14.7% for unknown-status records. The filtered view itself represents 35.1% of all graph records.
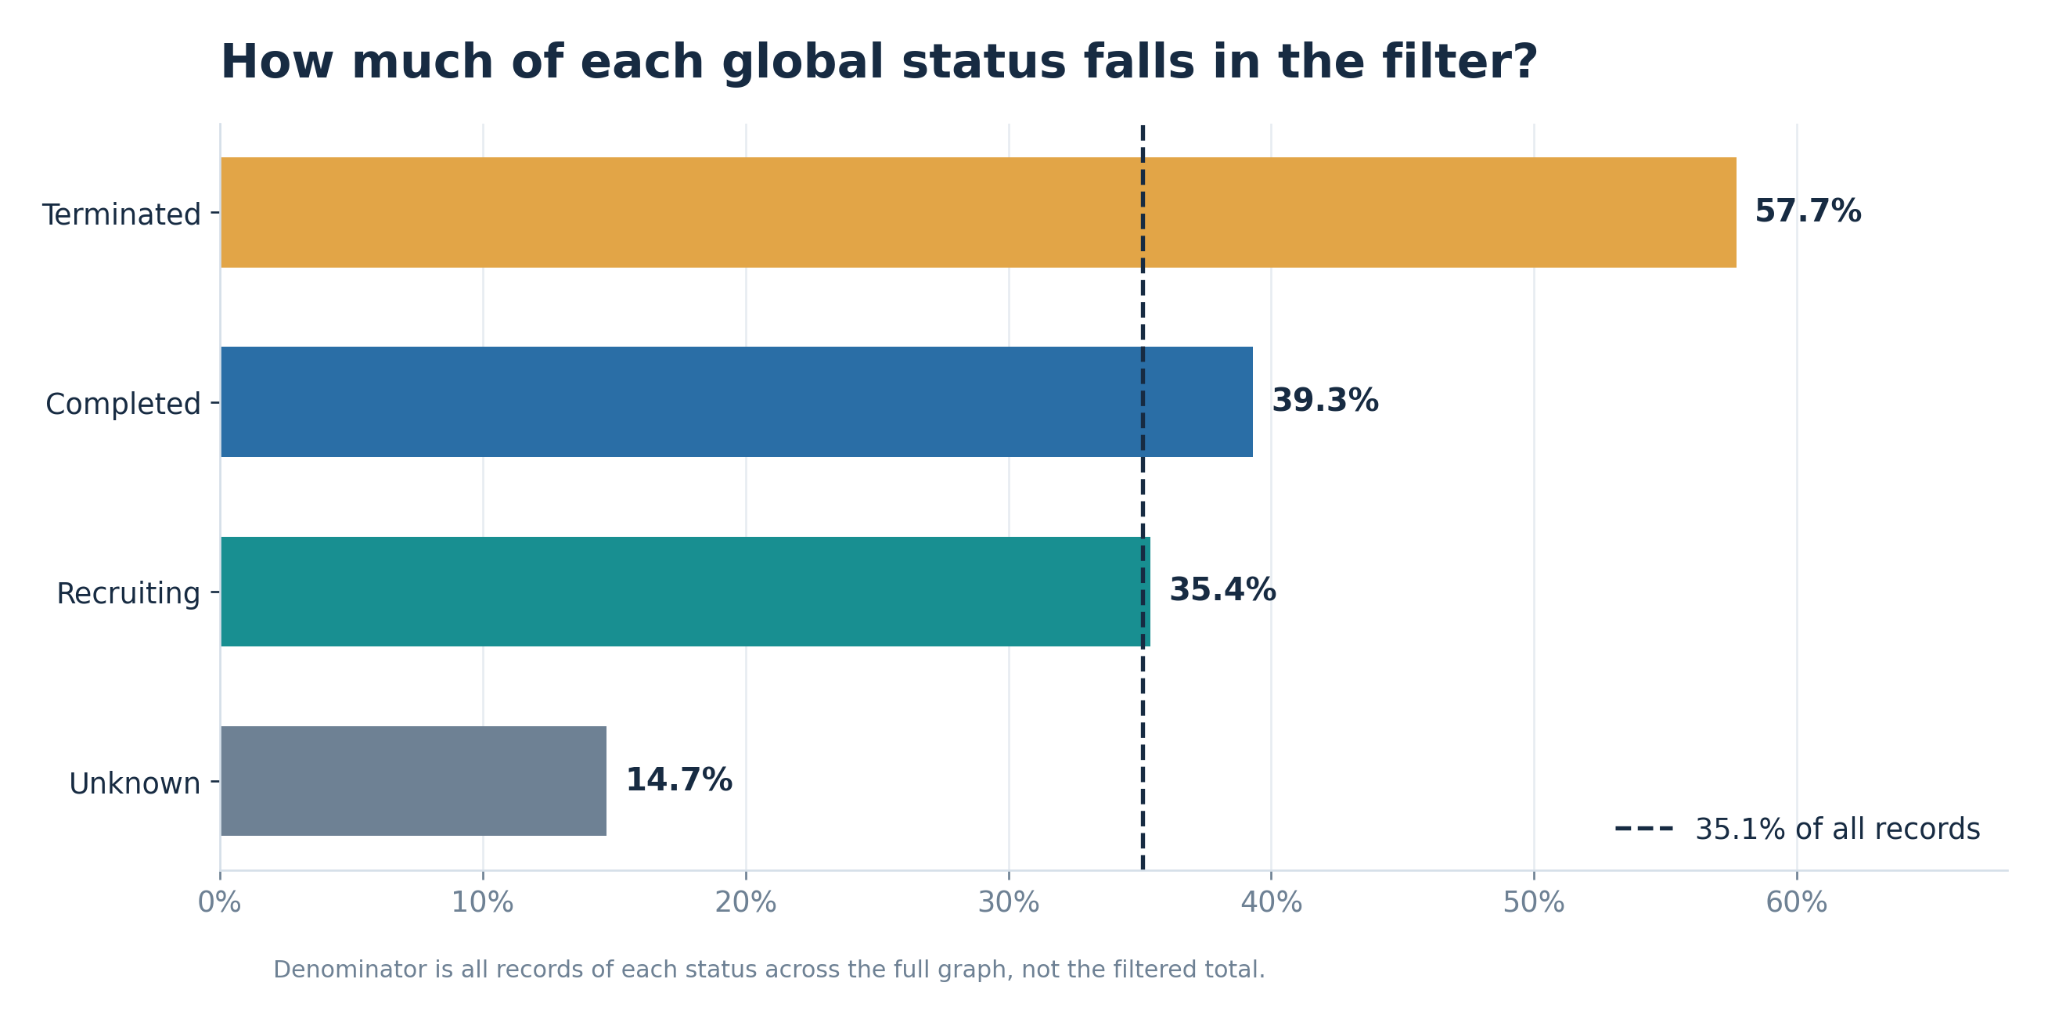
This concentration is not a clinical failure rate. A terminated study is a registry status, not necessarily evidence of ineffective treatment or poor research quality. Differences in historical coverage, trial types, sponsor mix and record updates may all affect the pattern; the report does not isolate those causes. The dashboard also displays 9,550 active-not-recruiting records in the filtered view. Because the published status table is selective, its four rows should not be treated as a complete breakdown of all 207,383 records.
How does NIH-classified sponsorship differ from the global baseline?
The three-country view records 9,500 NIH-classified lead-sponsor entries, or approximately 4.6% of its records. The source gives a global NIH-class share of 0.8%–2.6%, based on chart ordering rather than a fully printed count. Because the 9,500 filtered NIH records must also exist in the full graph, they establish a minimum global share of approximately 1.6%. A defensible comparison is therefore about 1.6%–2.6% globally versus 4.6% in the filtered view.
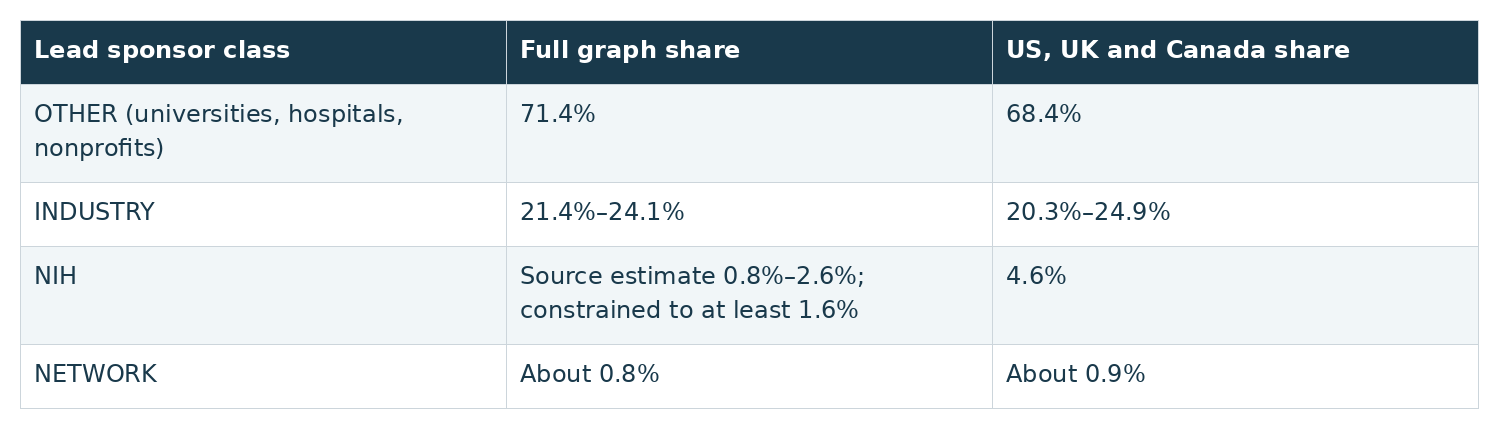
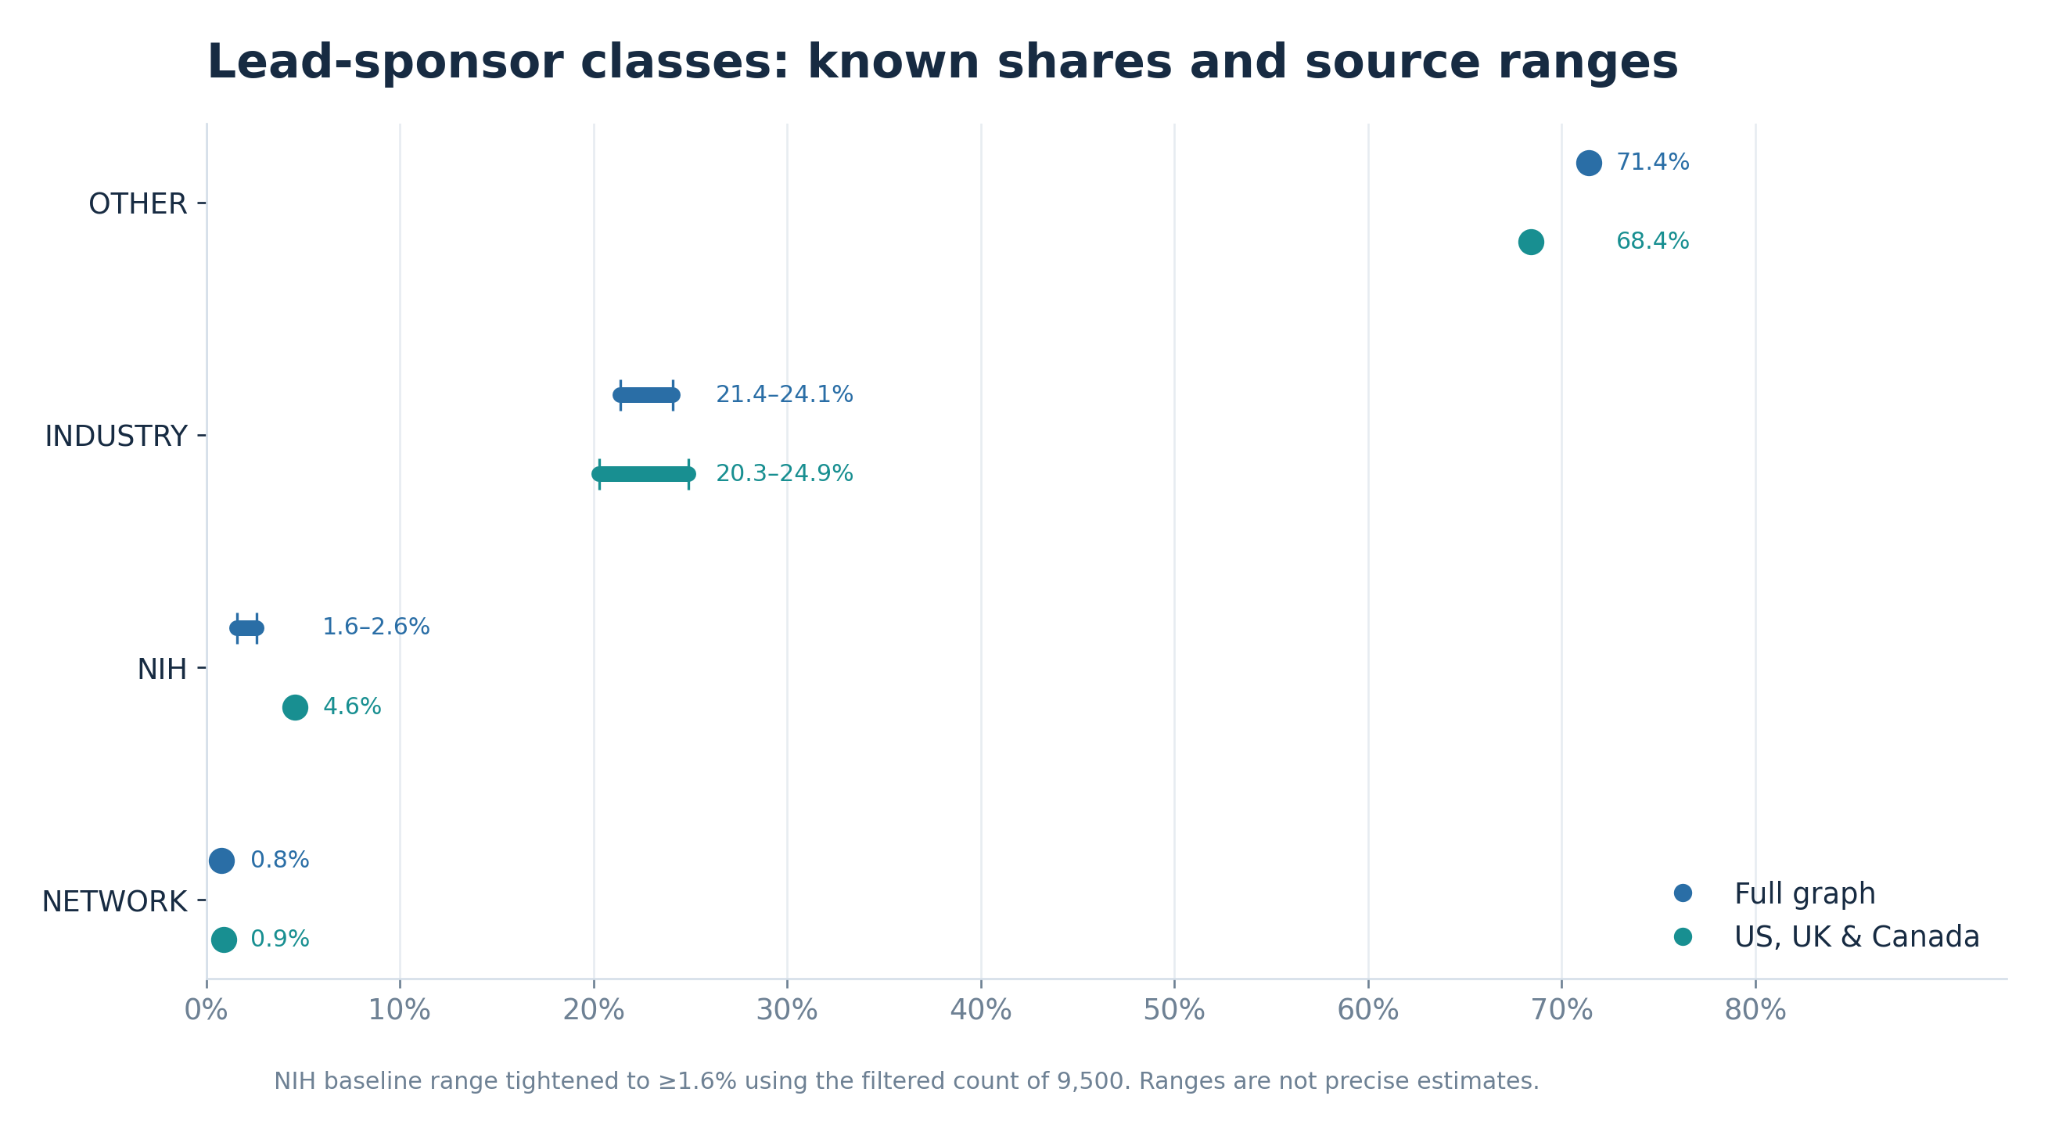
Even against the 2.6% upper bound, the filtered NIH share is at least 1.7 times the global baseline share. This is a comparison of lead-sponsor classifications, not a measurement of NIH funding amounts or a count of grants. The source's named lead-sponsor and collaborator rankings are separate analyses and should not be merged into one measure. The report also records OTHER as the dominant lead-sponsor class in both views: 71.4% globally and 68.4% in the three-country filter. The industry ranges overlap, so the source does not support a precise claim about which view has the higher industry share.
Which named institutions lead clinical trial records?
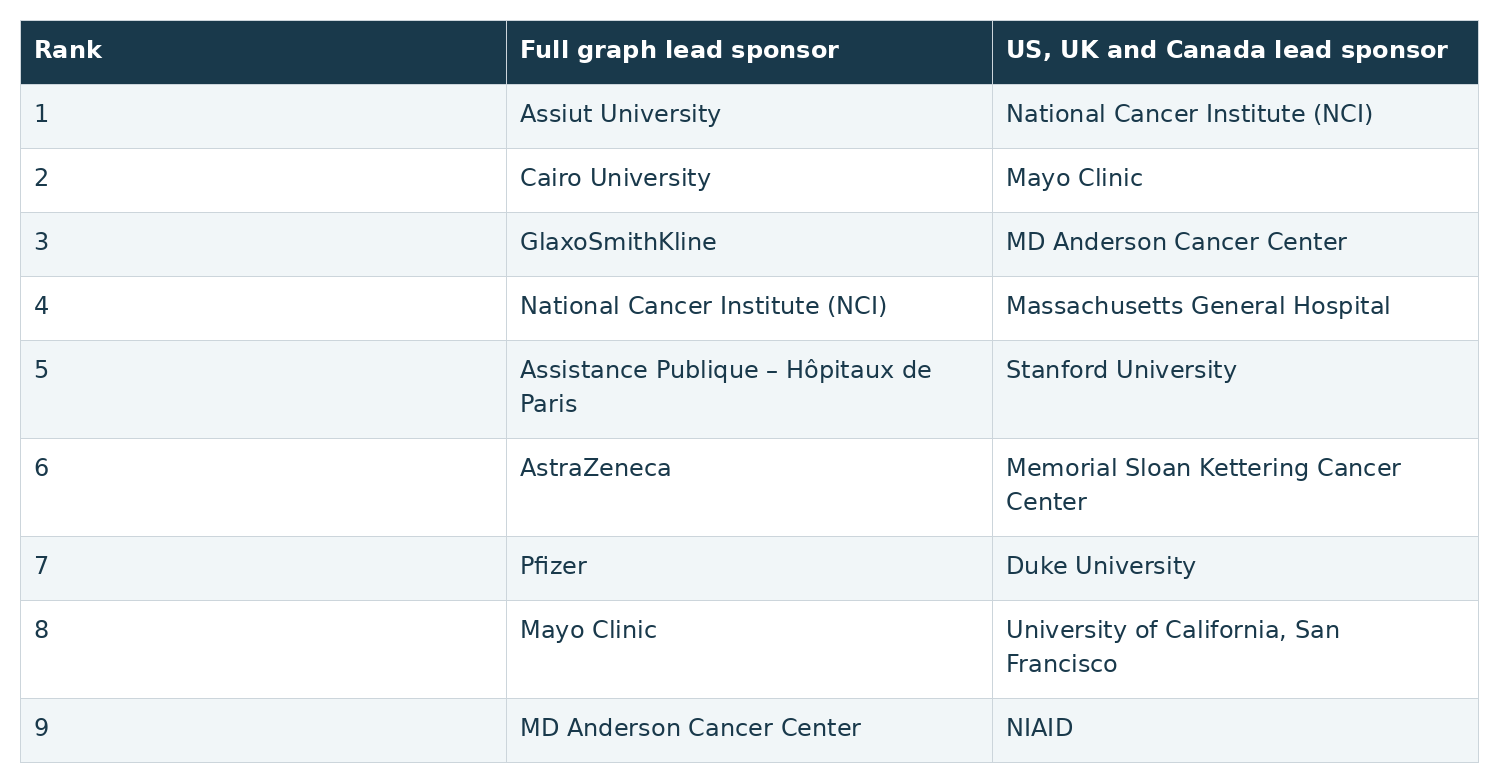
The named lead-sponsor rankings change substantially when the US, UK and Canada filter is applied. In the full graph, Assiut University and Cairo University occupy the top two positions, with several pharmaceutical companies also in the top ten. In the filtered view, the National Cancer Institute (NCI) ranks first, followed by Mayo Clinic and MD Anderson Cancer Center.
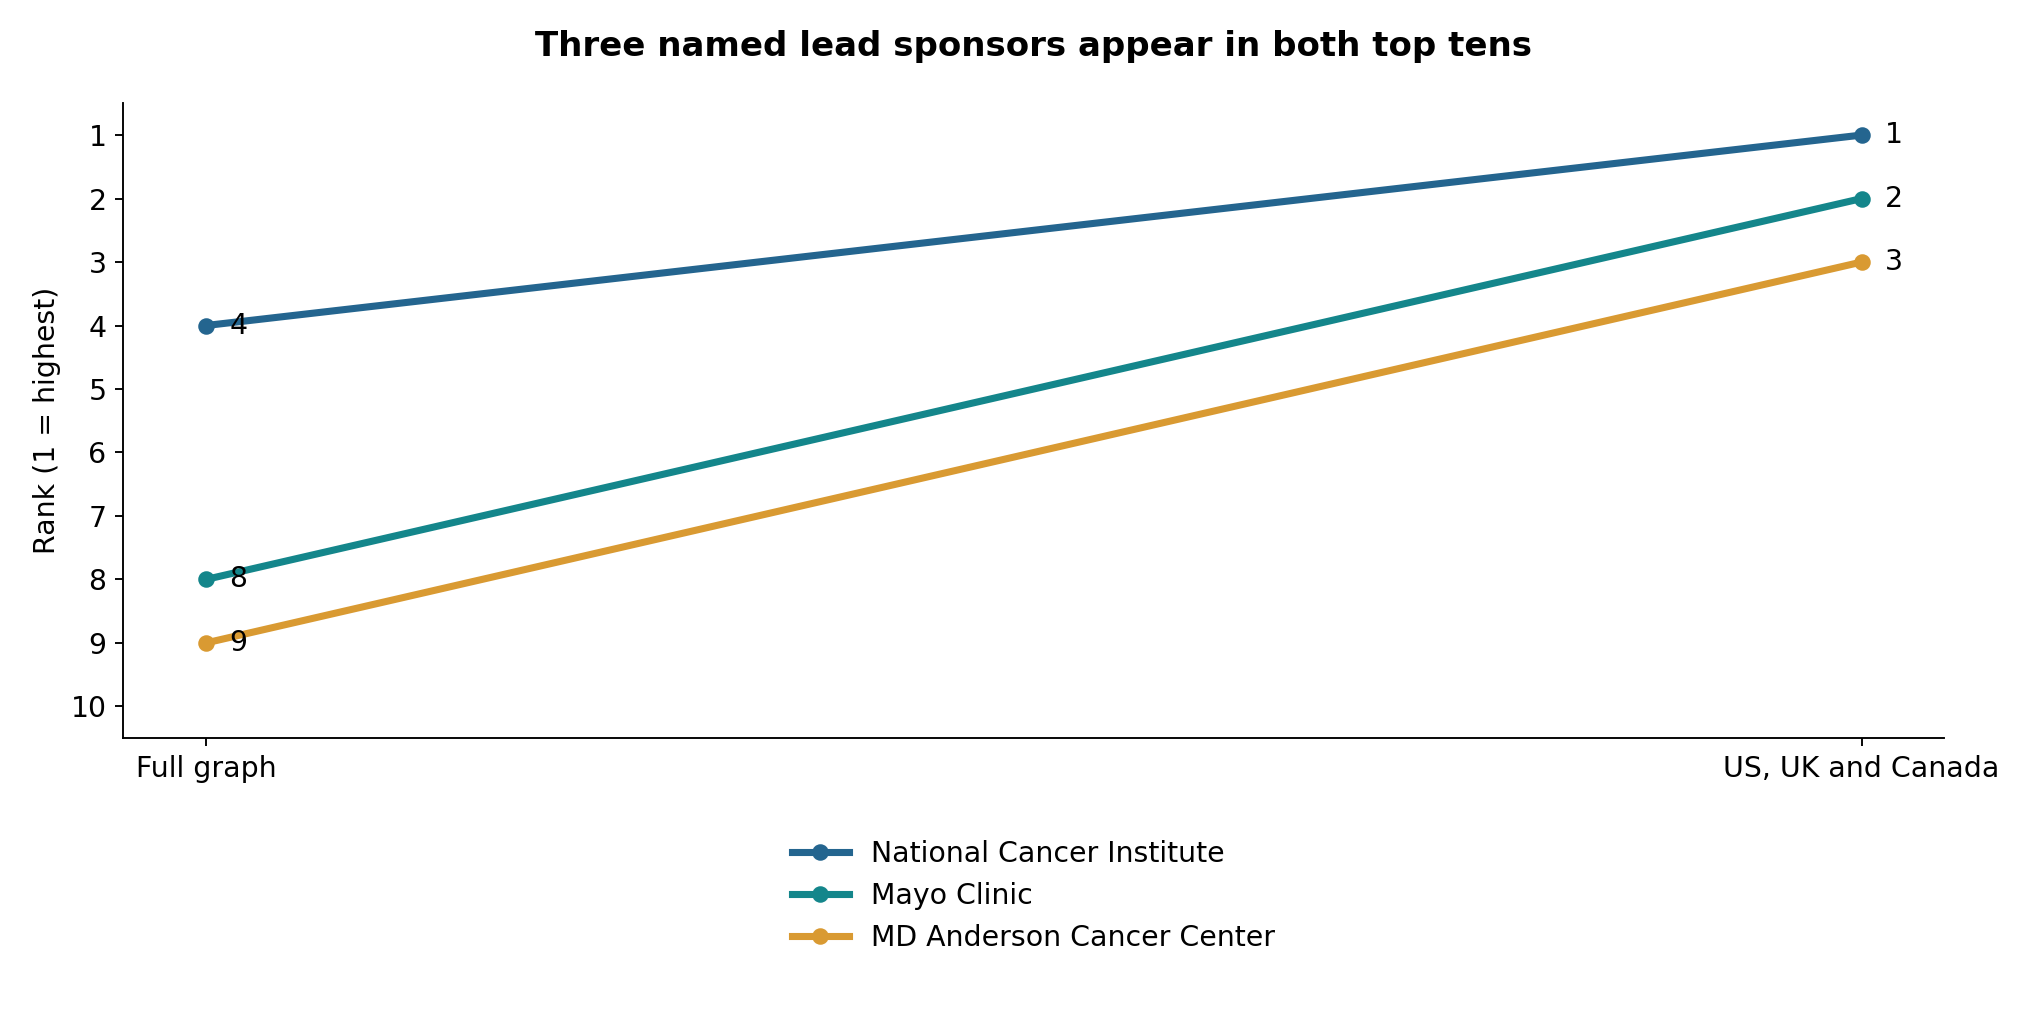
Only three named organizations are clearly present in both top tens: NCI, Mayo Clinic and MD Anderson Cancer Center. Their ranks change from 4 to 1, 8 to 2 and 9 to 3, respectively.
Which collaborators appear most often in the three-country view?
The report's collaborators tab displays ten organizations with a combined 17,296 mentions. The National Cancer Institute leads with 7,350 mentions, representing 42.5% of mentions among those ten displayed groups. The National Institute of Mental Health follows with 1,684, and the National Institute on Drug Abuse with 1,608.
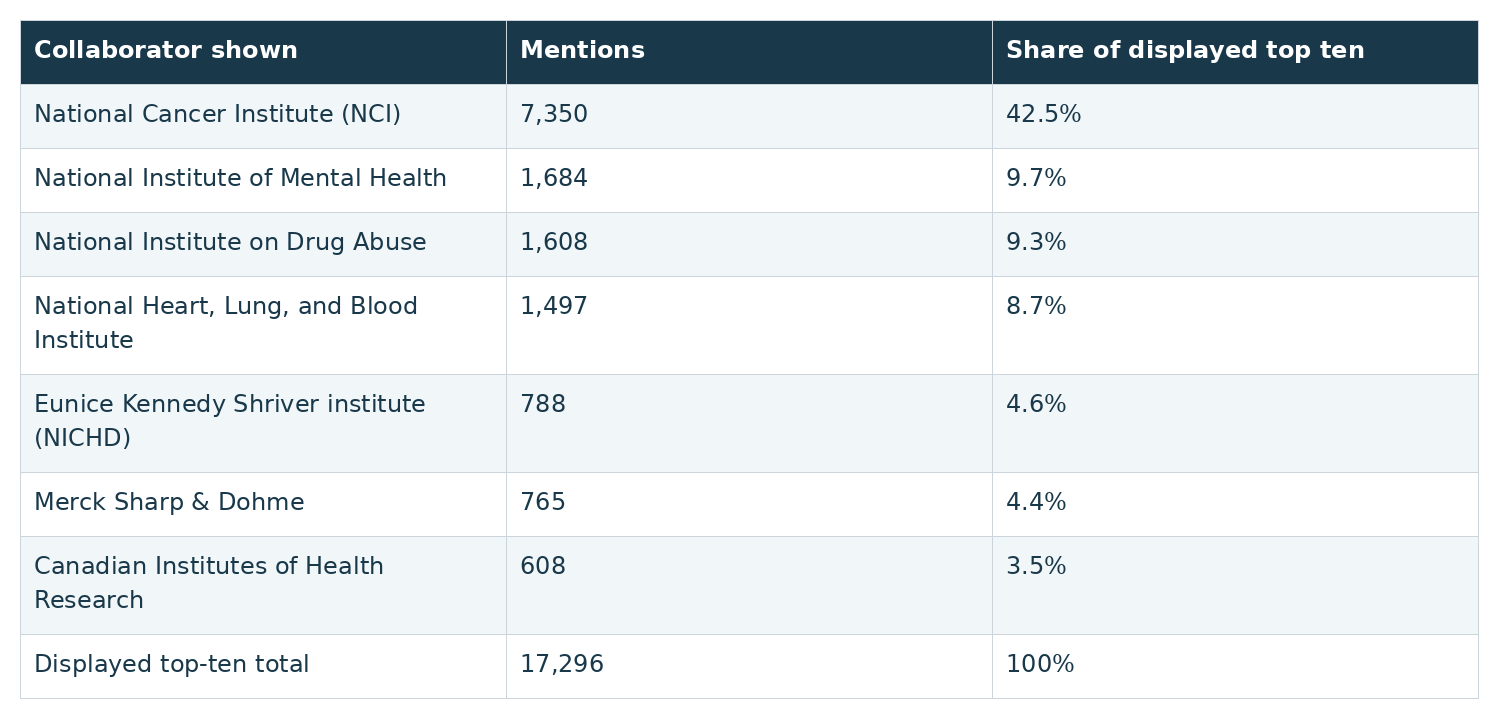
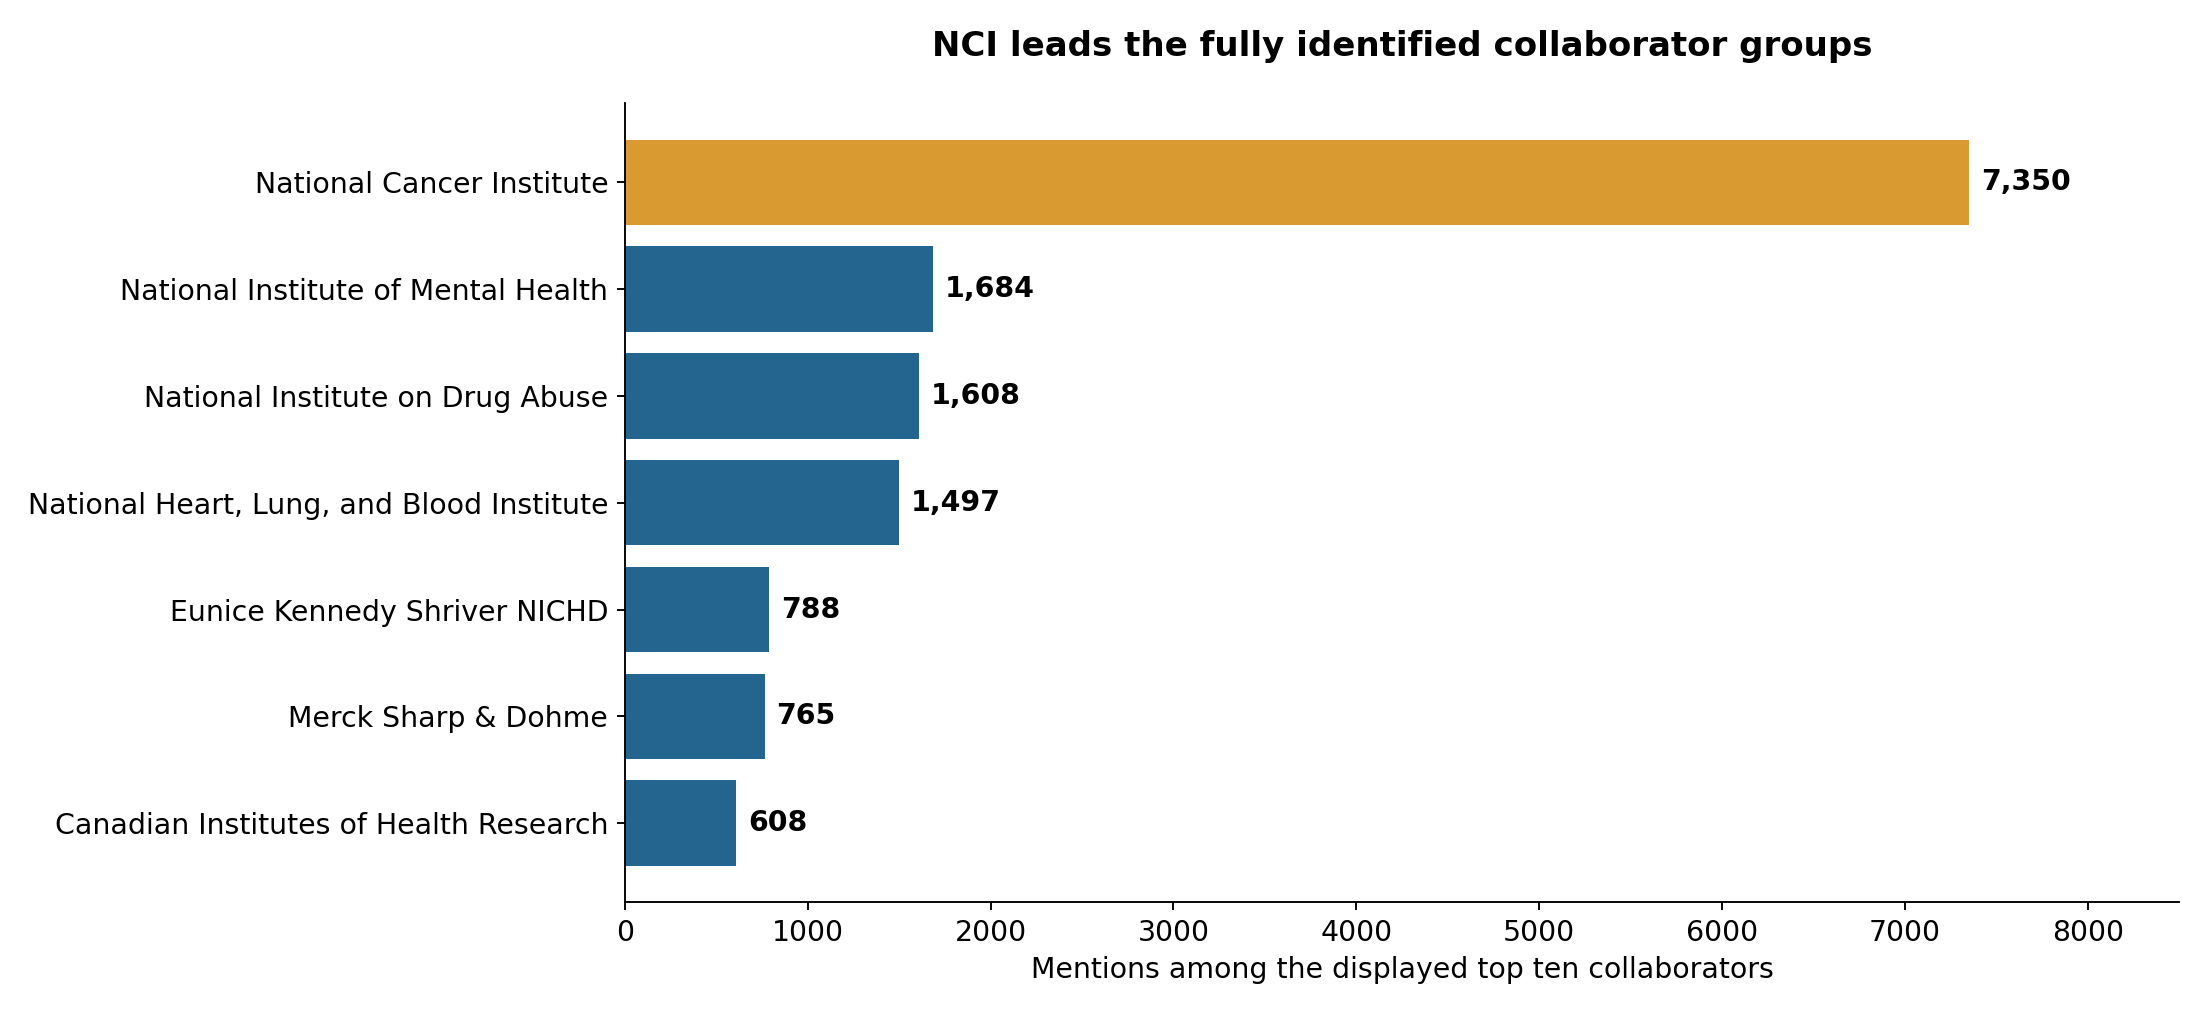
The collaborator comparison is limited to the filtered view. Three labels in the source are incomplete and are excluded from the named comparison. Their counts remain included in the 17,296-mention denominator, so the identified organizations should not be presented as the entire collaborator population. Collaborator mentions also do not equal unique trials, individual researchers or funding awards. A record may involve multiple collaborators, and the chart only displays the ten leading groups.
What can clinical research teams learn from these comparisons?
For clinical trial researchers, the most useful findings are the differences in status mix and lead-sponsor classifications. They provide concrete questions for further analysis: How are unknown statuses defined? Do terminated records differ by study type or registration year? How many NIH-classified records are led by each named organization? For readers comparing regions, the key caution is that a large share of a database does not automatically imply the same share of global clinical research activity. The directory's inclusion rules, update practices and geographic attribution affect what appears in the graph.
Methodology and limitations
Source: Solevant, Clinical Trial Analysis, based on the Clinical Trial Knowledge Graph. Dashboard views were captured on 5 October 2026. No underlying record-level export is available. Geographic filter: Combined US, GB and CA country codes. The report does not provide separate country counts, a London-only filter, or a method for assigning multinational records to countries. The unfiltered baseline includes the three-country records; it is not an independent control group. Units: “Records” means entries in the graph; “sites” means linked site records; enrollment is a sum of recorded enrollment values, not a count of unique participants. Rounded enrollment totals support only approximate averages and shares.
Study type: The full graph has 451,169 interventional, 138,055 observational, 1,056 expanded-access and 976 untyped records. The filtered view has 169,730 interventional, 37,222 observational and 431 expanded-access records, with no untyped records. Status: The published table covers four selected statuses. The dashboard also shows active-not-recruiting and other statuses. The mechanism assigning “unknown” is not verified, so lower unknown-status prevalence cannot be equated with better reporting performance. Sponsor classes: NIH and INDUSTRY baseline shares are ranges inferred by the source from partially labeled charts. The filtered NIH count of 9,500 constrains the baseline NIH share to at least 1.6%, even though the source's initial broad range begins at 0.8%. The ranges should not be replaced by invented point estimates.
Named sponsors and collaborators: The sponsor top tens are rankings, not published counts. Only fully identified sponsor and collaborator names are included in the named comparisons. The 17,296 collaborator mentions cover only the displayed top ten; no unfiltered collaborator comparison was supplied. Timing and interpretation: This is a single dashboard capture, not a time series, global trial census, clinical outcome study or measure of research quality. The report does not provide country-specific trial totals or patient-level data.
Frequently asked questions
How many clinical trial records are associated with the US, UK and Canada?
The combined filter returns 207,383 records, or 35.1% of Solevant's 591,256-record Clinical Trial Knowledge Graph.
Does the report give a separate clinical trial count for London?
No. The combined filter covers the United States, United Kingdom and Canada. It does not isolate London or report country-by-country totals.
What proportion of the filtered records are interventional?
81.8%, or 169,730 records, compared with 76.3% of the full graph.
Why is the unknown-status share lower?
The view records 6.6% unknown status versus 15.7% in the baseline. The report proposes a possible registry-update explanation but says the definition must be verified. The cause is not established.
Does the higher terminated share mean clinical trials are failing more often?
No. The three countries contain 57.7% of the graph's terminated records, but that is a database distribution, not a clinical failure rate or an assessment of trial outcomes.
How prominent is NIH-classified sponsorship?
The filtered view has 9,500 NIH-classified lead-sponsor records (4.6%). The source's estimated baseline ceiling is 2.6%, so the filtered share is at least 1.7 times that ceiling.
Which institution leads the filtered sponsor ranking?
The National Cancer Institute (NCI) ranks first among named lead sponsors, followed by Mayo Clinic and MD Anderson Cancer Center.
Does NCI account for 42.5% of all collaborations?
No. Its 7,350 mentions represent 42.5% of the 17,296 mentions among the ten displayed collaborators only. The report does not provide a total for every collaborator in the database.
Conclusion
The US, UK and Canada account for slightly more than one in three records in Solevant's Clinical Trial Knowledge Graph. Compared with the full graph, the combined view contains a higher share of interventional and completed records, a lower share of unknown statuses and a stronger NIH-classified lead-sponsor presence. Terminated records are especially concentrated in the filter, while the named sponsor top ten shifts toward research hospitals and federal institutes. The evidence supports a careful comparison of recorded clinical research activity, not claims about national trial totals, reporting quality or patient outcomes. Status definitions and country-level totals are not available for separate national comparisons.
Source: Solevant, Clinical Trial Analysis (London and the North American Story), 5 October 2026.