
SaaS Integrations by Category: 978 Categories and 100,555 Products Analysed
How connected are the software products in different SaaS categories? Do categories with more integrations also have higher prices? Solevant's SaaS Integrations by Category report examines 978 software categories covering 100,555 product listings. It compares the average number of integrations per product within each category, identifies unusually high- and low-integration categories, and examines whether integration density is associated with average listed price.
The headline finding is that the median category averages just 3.5 integrations per product. Only 10 categories average at least 30 integrations, while 61 categories have a recorded average of zero. Across 672 categories with at least 20 products, the reported correlation between average integrations and average price is -0.028, indicating virtually no linear relationship in this dataset. These are category-level averages, not individual product integration counts or a census of every SaaS product worldwide.
Key findings
- 978 categories cover 100,555 product listings in the source catalog.
- The median category averages 3.5 integrations per product.
- 844 categories (86.3%) fall below an average of 10 integrations, including the zero-integration group.
- 10 categories (1.0%) average 30 or more integrations per product.
- 61 categories (6.2%) have a recorded average of zero, while 29 (3.0%) have no integration value.
- SaaS Management has the highest recorded average at 211.6, followed by Server Monitoring at 157.8.
- Oil and Gas has a recorded average of 0.0 integrations across 186 products; missing vendor information could contribute to this result.
- The correlation between integration density and average price is -0.028 across 672 categories with 20 or more products.
What does integration density mean in SaaS?
Integration density is the average number of recorded integrations per product within a software category. A category averaging 20 integrations is not a claim that every product in it connects to 20 other tools. Some products may have many integrations and others few or none. It is also important to distinguish a recorded zero from a verified lack of integrations. The report notes that a zero may reflect products that are largely standalone, incomplete integration fields, or both. The source does not provide product-level evidence to distinguish these explanations.
How many integrations does a typical SaaS category have?
Most categories cluster at the low end of the integration scale. The median category average is 3.5 integrations per product, and the largest group consists of 554 categories (56.6%) averaging between 2 and 10 integrations.
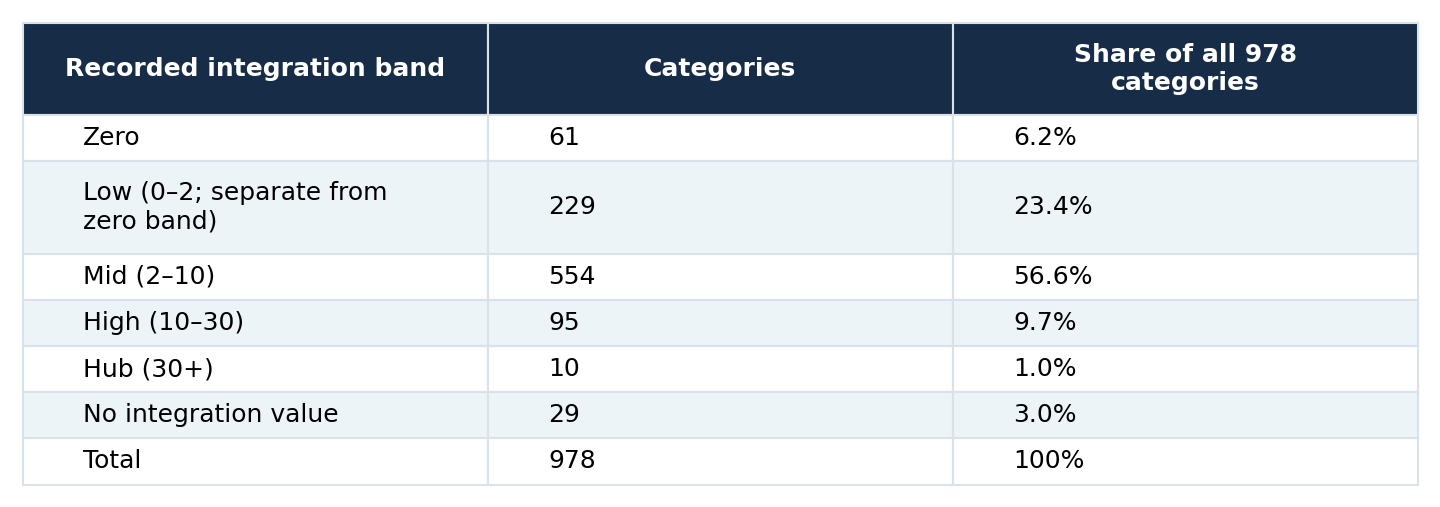
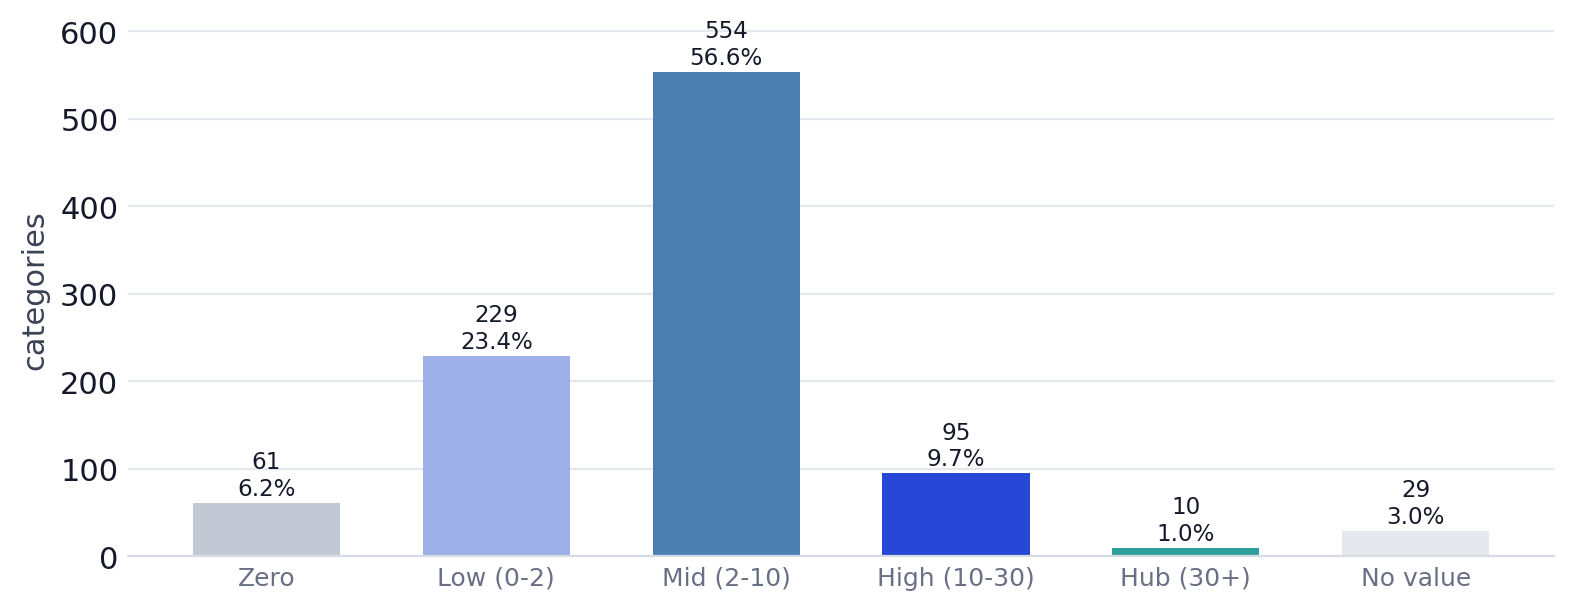
Of 978 categories, 554 fall in the 2–10 band, 61 have a recorded zero, 10 average at least 30, and 29 have no integration value.
The five numerical bands contain 949 categories; the remaining 29 are reported separately because their integration value is missing. The source labels its low band "0–2" despite showing zero as a separate band, so these groups are treated as mutually exclusive exactly as reported. The total below 10 integrations is 844 categories, or approximately 86.3% of all categories. That figure describes the distribution of category averages. It does not mean 86.3% of individual SaaS products have fewer than 10 integrations.
Which SaaS categories have the most integrations?
SaaS Management is the clearest outlier, averaging 211.6 integrations per product across 84 products. Server Monitoring follows at 157.8 across 24 products. Both are far above the rest of the reported ranking. The next categories are Corporate Tax (59.3), Retargeting (55.3), and Marketing Attribution (40.3).
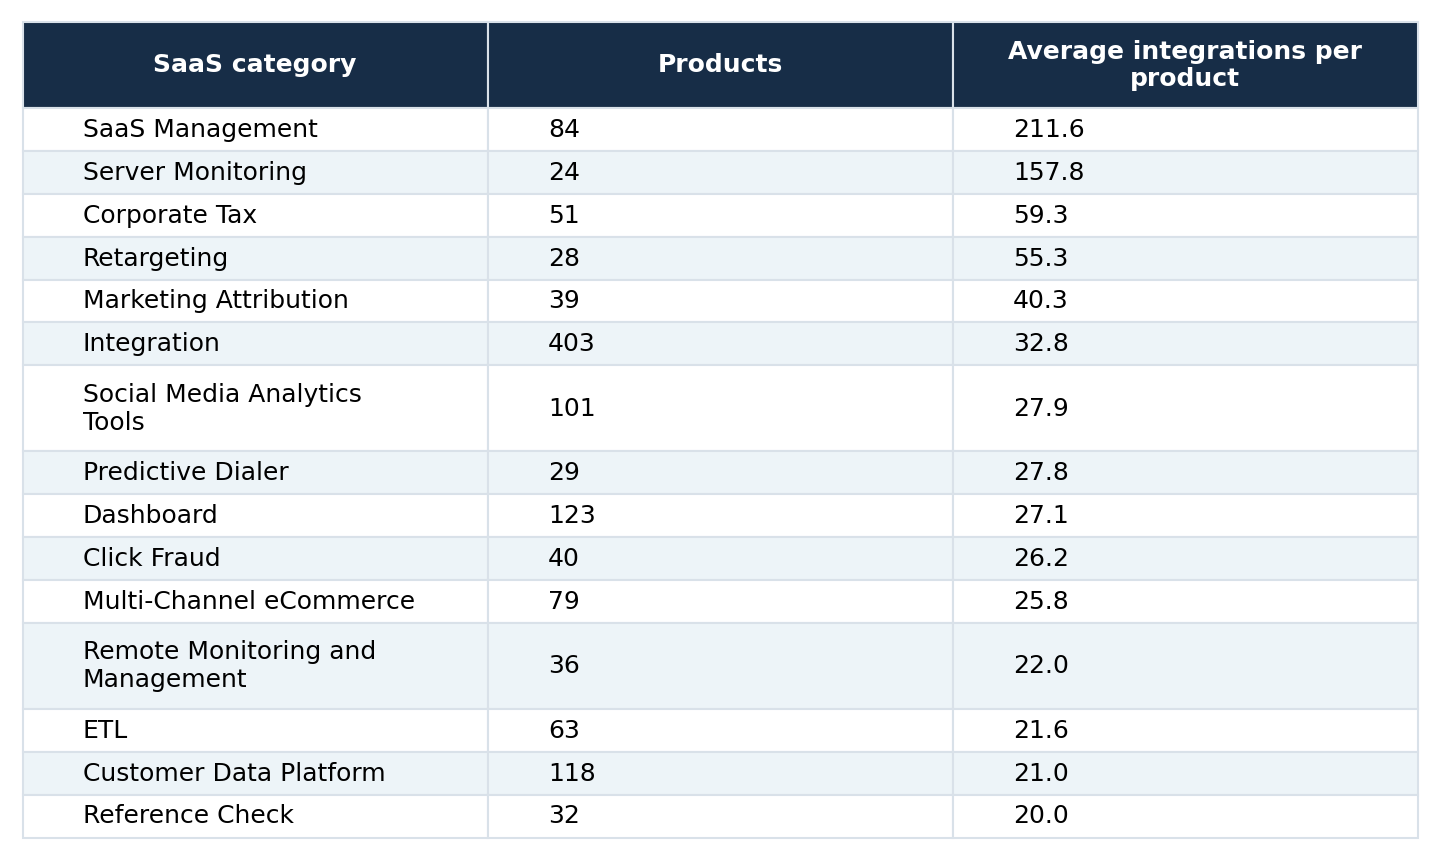
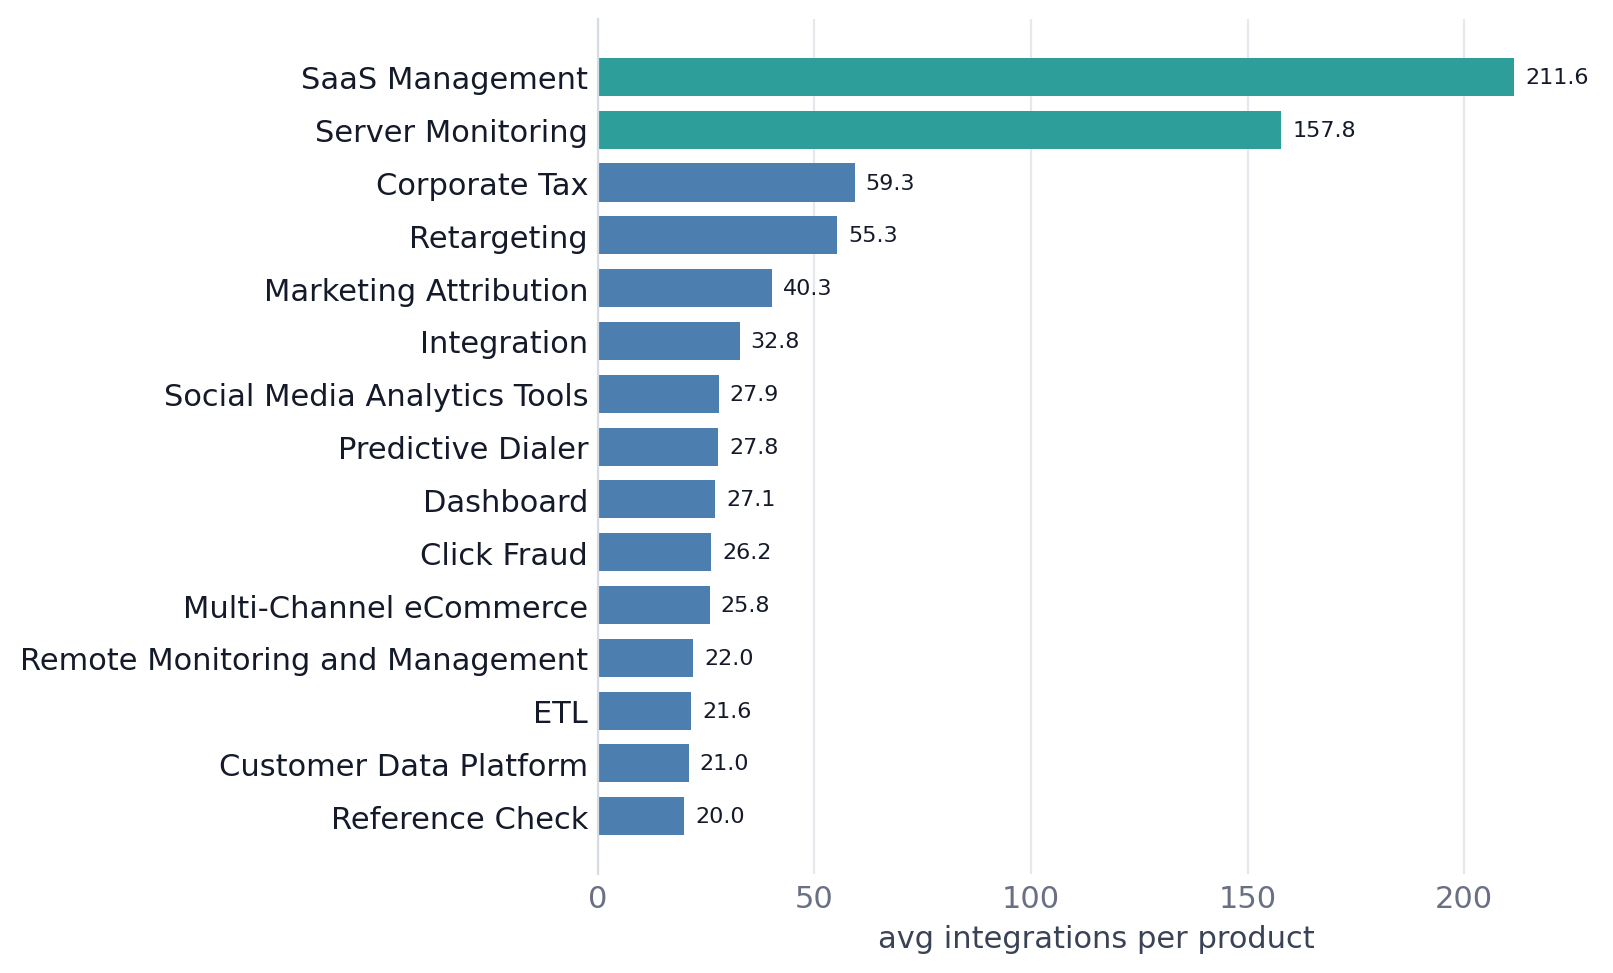
SaaS Management averages 211.6 integrations per product, followed by Server Monitoring at 157.8. The chart includes categories with at least 20 products and an average of at least 20 integrations.
Why are there 15 categories in the chart but only 10 integration hubs?
The report uses two thresholds for different purposes. Its strict hub band includes categories averaging 30 or more integrations, producing 10 categories across the full dataset. The ranking chart uses a broader inclusion rule: at least 20 products and an average of at least 20 integrations, producing the 15 categories shown above. These definitions should not be conflated. The 15-category ranking is not a claim that all 15 belong to the strict 30-plus hub band.
The source describes several high-integration categories as general-purpose or cross-system software, including Integration, ETL, Dashboard, and Customer Data Platform. This is a descriptive pattern in the listed examples, not evidence of why those categories have more recorded integrations.
Which SaaS categories have the fewest integrations?
At the opposite end, the report highlights 14 relatively large categories averaging fewer than one integration per product. Many are associated with specific industries or operational functions.
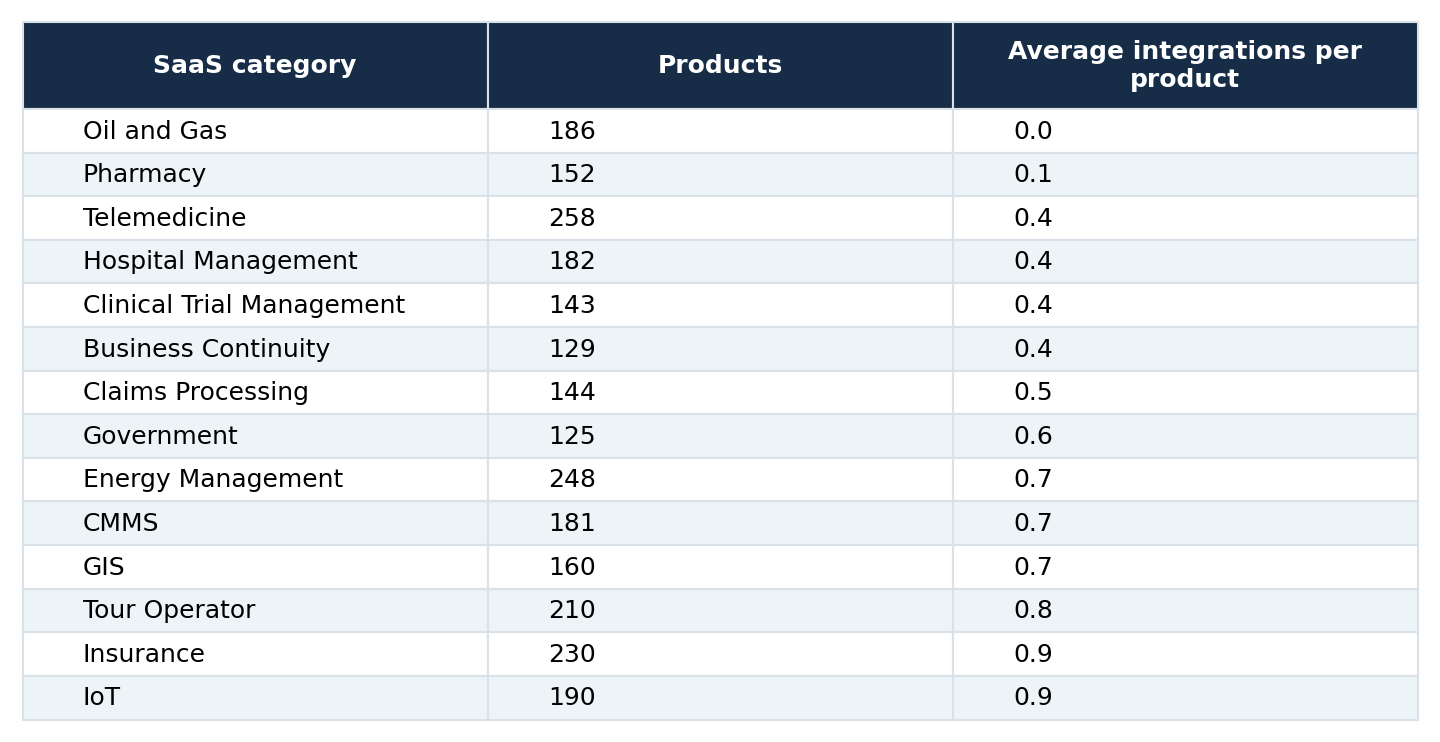
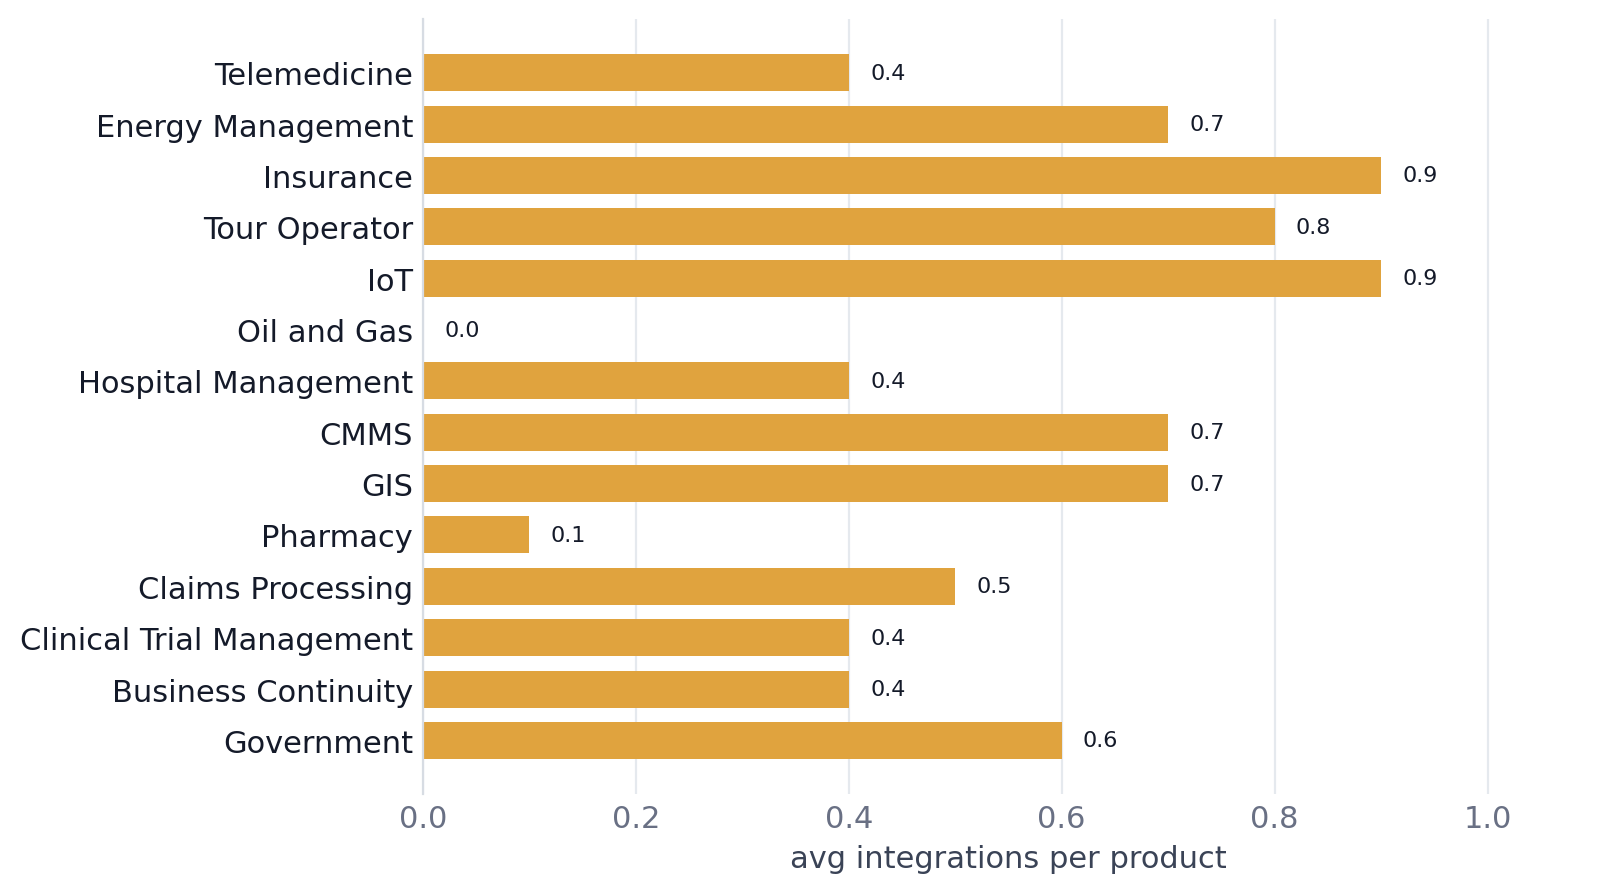
Oil and Gas records 0.0 average integrations across 186 products; Pharmacy records 0.1 across 152. A low recorded average may reflect missing integration information as well as genuinely limited integrations.
The sample sizes are substantial. Telemedicine has 258 products, Energy Management 248, and Insurance 230, yet each averages fewer than one recorded integration per product.
Does an average of zero mean a category has no integrations?
Not necessarily. Oil and Gas has a recorded average of 0.0 across 186 products, but the report explicitly cautions that this could reflect integration fields that vendors did not populate. The defensible conclusion is that the recorded integration average is zero, not that every Oil and Gas product is technically incapable of connecting to another system. Similarly, low averages in healthcare, insurance, and other industry-specific categories should not be interpreted as evidence of product quality, interoperability standards, or buyer preferences without additional data.
Do SaaS categories with more integrations cost more?
The report examines 672 categories containing at least 20 products and finds a Pearson correlation of -0.028 between average integrations and average listed price. A correlation this close to zero indicates almost no linear association in the observed category averages. It does not show that integration features never influence a product's price, and it does not test causal effects.
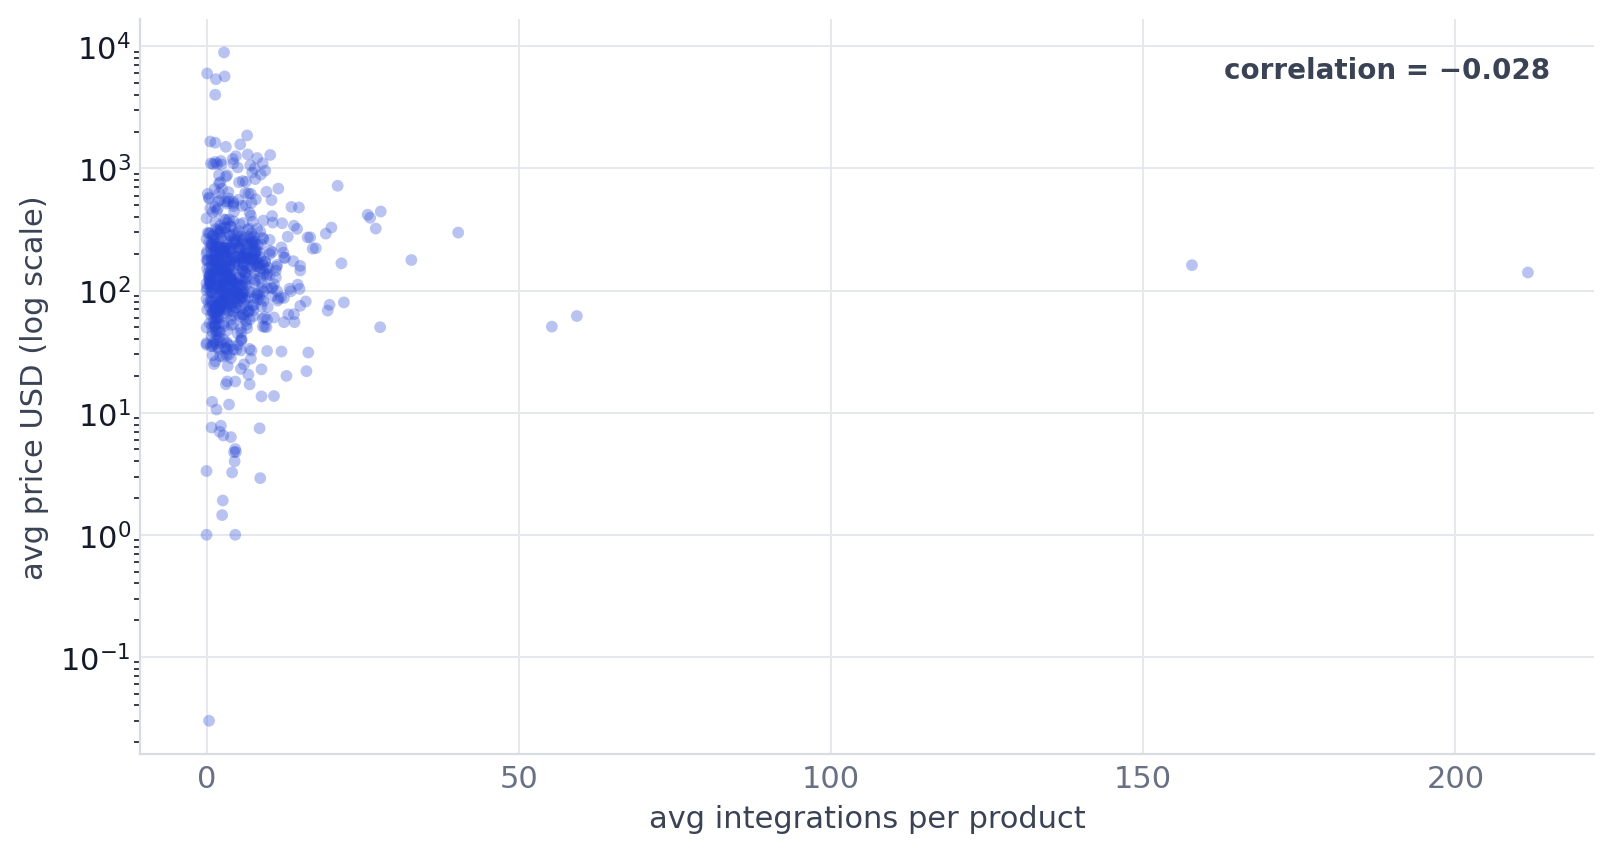
The report's scatterplot compares average integrations with average listed price across 672 categories with at least 20 products. The vertical price axis is logarithmic; reported Pearson correlation = -0.028. The examples make the weak relationship tangible:
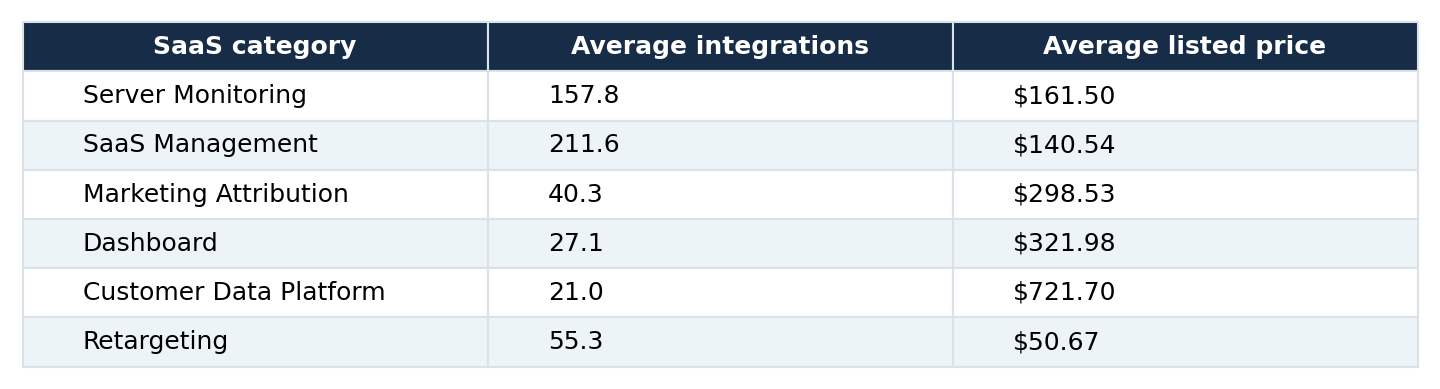
Customer Data Platform has far fewer recorded integrations than Server Monitoring, yet its reported average price is much higher. Retargeting averages 55.3 integrations at $50.67, while Dashboard averages 27.1 at $321.98. These are comparisons of category averages, not matched products with identical features or plans. They also do not establish that all products within a category have similar prices.
How reliable are the average price figures?
The report warns that some category price averages are based on very few priced products. Reference Check has an average listed price of $328.25 based on only two priced products, and Embedded Analytics has a price average based on one. Such figures can change sharply if additional prices are recorded. The source does not supply enough pricing observations to calculate confidence intervals or determine how representative every category average is.
What do these findings mean for software comparisons?
The data suggests that integration count alone is a weak basis for comparing SaaS categories by price. Two categories can have very different average prices despite similar integration levels, and categories with many integrations are not consistently the most expensive. For a buyer comparing individual products, the number of integrations is also different from whether a product connects to the specific systems they use. The report does not evaluate integration quality, supported data flows, reliability, or implementation effort.
For market researchers, the distinction between category averages and product-level values is essential. The dataset can describe how categories differ in recorded integration density, but it cannot identify how integrations affect a particular product's price or adoption.
Methodology and data limitations
This analysis uses the category-level figures and charts in Solevant's SaaS Integrations by Category report. Underlying product-level records were not independently recalculated. The report describes 978 categories covering 100,555 product listings. Its central measure is the average number of recorded integrations per product within each category. The price analysis uses 672 categories with at least 20 products and reports a Pearson correlation of -0.028. Important limitations include: No reporting period or update frequency is supplied.
29 categories have no integration value and are not included in the five numerical distribution bands. Zero integration values may reflect incomplete fields, not necessarily verified absence of connectivity. Category averages hide product-level variation, both for integrations and for price. Some price averages use very small samples, including Reference Check (two priced products) and Embedded Analytics (one). The correlation is observational and category-level; it does not establish whether adding integrations changes product prices.
The report's workbook also contains a country-level sheet, but country-level findings are outside this analysis. The report's integration bands are reproduced as published, including its separate Zero and Low (0–2) labels. Their totals reconcile when the 29 missing-value categories are included.
Frequently asked questions
How many SaaS categories are covered?
The report covers 978 categories, representing 100,555 product listings in Solevant's catalog.
What is the average number of integrations in a typical category?
The median of category averages is 3.5 integrations per product. This is not a median calculated across individual products.
What percentage of categories average fewer than 10 integrations?
844 of 978 categories, approximately 86.3%, fall below an average of 10 integrations per product.
Which SaaS category has the most integrations?
SaaS Management, averaging 211.6 integrations per product, followed by Server Monitoring at 157.8.
What is an integration hub?
In the report's distribution, a hub is a category averaging 30 or more integrations per product. There are 10 such categories.
Which categories have the lowest integration averages?
Oil and Gas records 0.0, Pharmacy 0.1, and Telemedicine and Hospital Management 0.4 each. These are recorded averages, not verified technical limitations.
Do more integrations mean higher SaaS prices?
Not in this category-level dataset. The reported correlation between average integrations and average price is -0.028 across 672 categories with at least 20 products.
Are all category prices based on large samples?
No. Some averages use only one or two priced products, so individual category price comparisons require caution.
Conclusion
Solevant's integration analysis shows a software catalog dominated by categories with relatively few recorded integrations. The median category averages 3.5 integrations per product, and only 10 of 978 categories reach the strict hub threshold of 30 or more. A handful of categories, led by SaaS Management and Server Monitoring, sit far above the rest. At the other extreme, several sizeable industry-specific categories have averages below one. Yet the relationship between integration density and average listed price is almost nonexistent at the category level, with a reported correlation of -0.028.
The central takeaway is that integration density varies greatly across SaaS categories, but integration count by itself does not explain category-level pricing. The results are most useful when read alongside their limits: incomplete integration fields, uneven pricing samples, and averages that can conceal substantial differences between individual products.