

SaaS Pricing Models: Quote-Required, Monthly Pricing and Free Trials by Category
How do SaaS companies present their prices to prospective customers? Some software listings require a sales quote, others publish a monthly price, and some provide a free trial. These signals can coexist within the same product or software category. Solevant's SaaS Pricing Model Adoption by Category report compares those three signals across separate sets of software categories. Its central finding is that 40.91% of products require a quote in the median category in the quote-required table. The equivalent medians are 12.90% for published monthly pricing and 7.41% for free-trial availability.
The study measures the share of products carrying each signal within a category. It does not report the share of all SaaS products worldwide using each model, and the three tables do not cover identical categories.
Key findings
- Quote-required pricing has the highest median category rate: 40.91% across 941 categories.
- Published monthly pricing has a median category rate of 12.90% across 799 categories.
- Free trials have a median category rate of 7.41% across 645 categories.
- The quote-required median is approximately 3.2 times the monthly-pricing median and 5.5 times the free-trial median, although the samples differ.
- Quote-required rates vary widely: the middle half of categories runs from 11.11% to 64.29%.
- 129 categories are recorded at 100% quote-required, but category product counts were not provided.
- Construction Management (9.89%), Financial Services (9.88%), and Attendance Tracking (9.84%) lead the report's selected recognizable free-trial examples.
- Payroll has the lowest listed free-trial rate at 0.29%, while Photo Editing has the lowest listed quote-required rate at 1.10%.
What are the three SaaS pricing signals?
The report examines three distinct attributes of product listings. Quote required means the listing indicates that a buyer must contact sales to obtain a price. Monthly pricing means the listing publishes a monthly price. Free trial means the listing indicates that a time-limited trial is available. These are not mutually exclusive pricing models. A product may publish a monthly price for one plan, require a quote for another, and offer a free trial. Consequently, a category's percentages for the three signals may add up to more than 100%.
The report analyzes 941 categories for quote-required status, 799 for monthly pricing, and 645 for free trials. Only 581 categories appear in all three tables. Its headline medians therefore compare the distributions of different category samples, not three rates calculated over one common set of products.
How do SaaS pricing models compare across categories?
The median is the central measure in this study: half of the categories in a given table fall at or below that rate, and half at or above it. The report also provides means and the 25th and 75th percentiles.

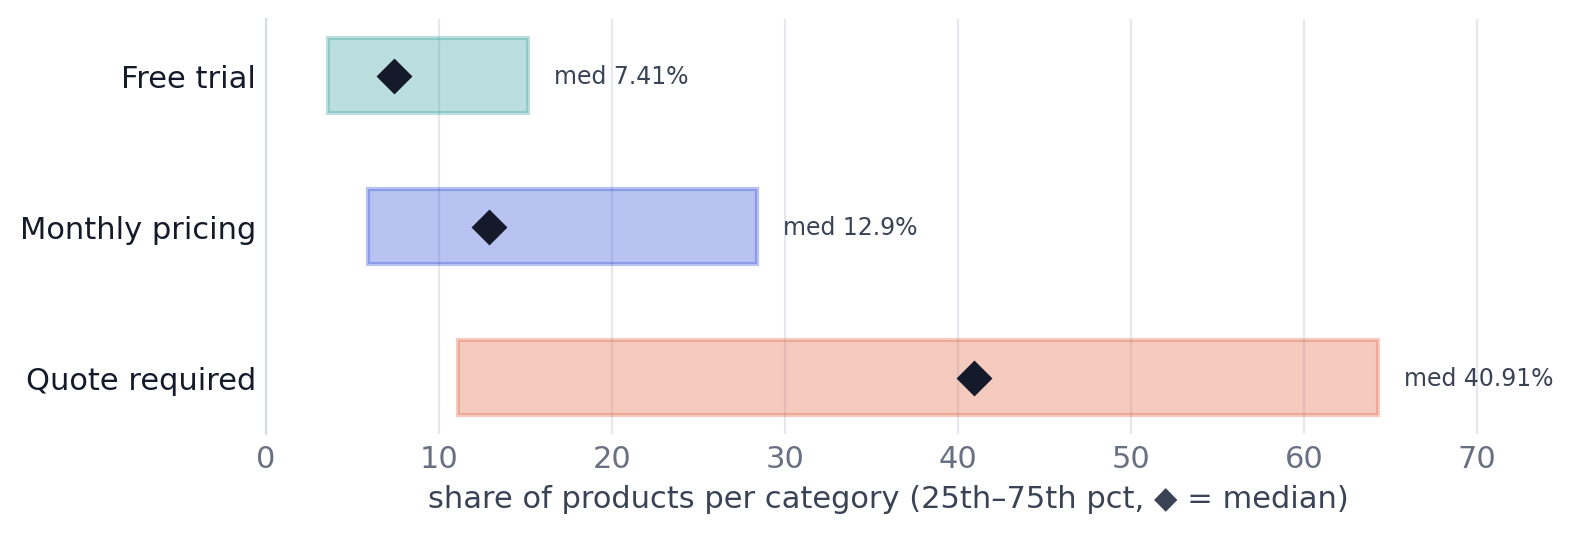
Each horizontal bar spans the 25th to 75th percentile of category-level adoption rates; the diamond marks the median. The three signals use different category samples.
Quote-required pricing has both the highest median and the widest middle-half range. Monthly pricing and free trials have lower median rates, although their distributions overlap with the quote-required distribution. The means for monthly pricing and free trials are noticeably higher than their medians. This indicates that higher category-level rates influence those averages. Because the supplied tables do not include product counts per category, the report cannot establish how much of that difference comes from very small categories.
What does a 40.91% quote-required median actually mean?
It means that, among the 941 categories measured for quote-required status, the middle category has approximately 40.91% of its products marked quote-required. It does not mean that 40.91% of all products in Solevant's catalog, or of the global SaaS market, require a quote. The same distinction applies to the 12.90% monthly-pricing and 7.41% free-trial medians.
How widely does quote-required pricing vary?
The report records quote-required rates ranging from 1.10% in Photo Editing to 100% in multiple categories. Its interquartile range, 11.11% to 64.29%, shows substantial variation even among the middle half of categories.
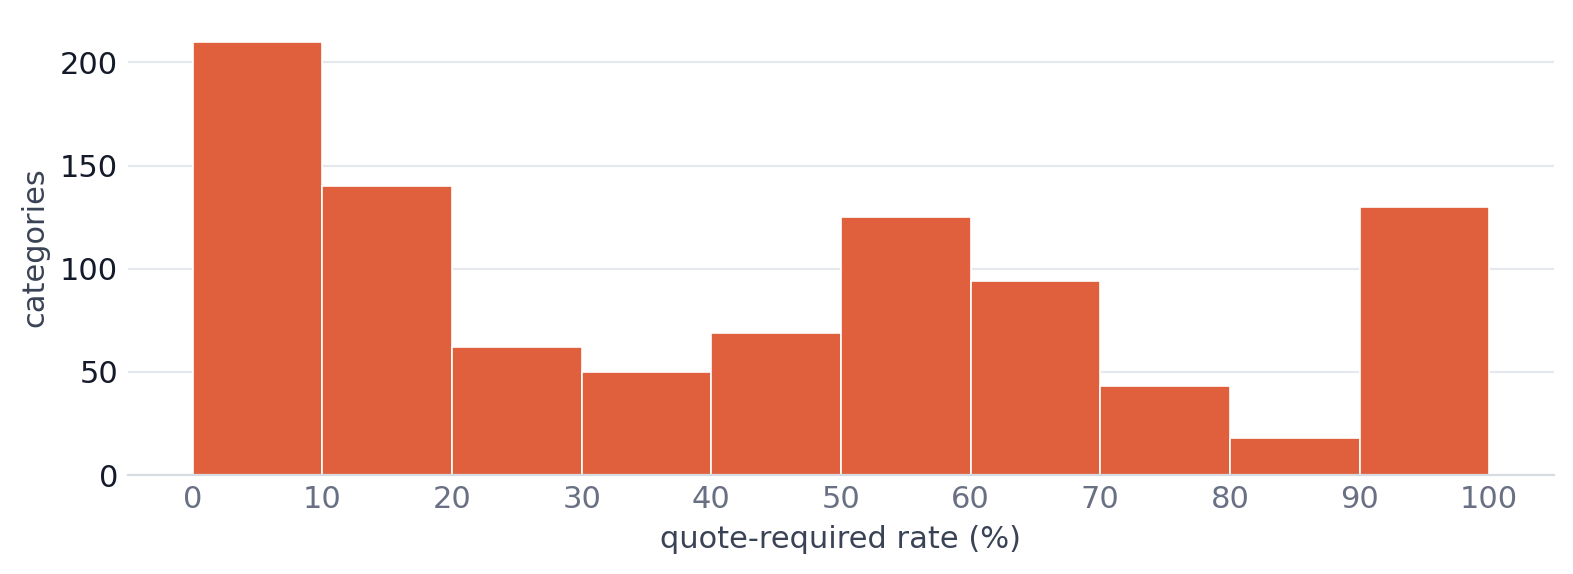
The source report's histogram shows quote-required rates distributed across the full 0-100% range. The report identifies 129 categories at exactly 100%; individual histogram-bin counts were not supplied in the tables.
The report identifies 129 categories at 100% quote-required, alongside 64 categories at 100% monthly pricing and 30 at 100% free trial. These counts come from three different tables and are not necessarily mutually exclusive. A 100% rate can be reached easily by a category containing only one or two products. The source tables do not provide product counts for individual categories, so it is not possible to verify which 100% results represent substantial markets and which represent small samples.
Which SaaS categories have the highest and lowest free-trial rates?
The report highlights a group of recognizable categories with free-trial rates close to 10%, and another group where the recorded rate is below 1%.
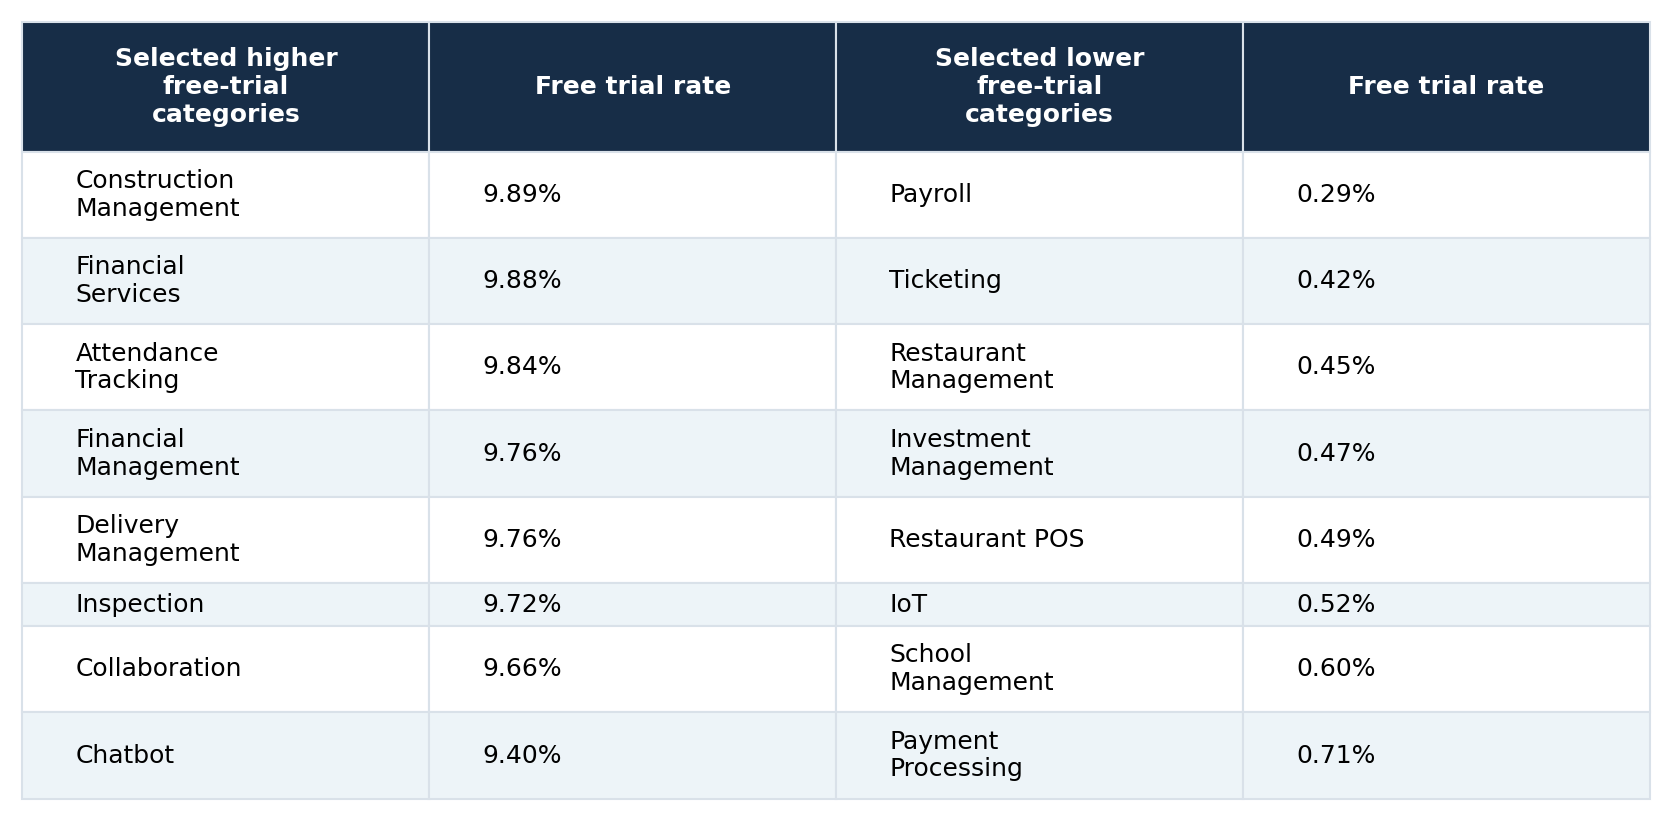
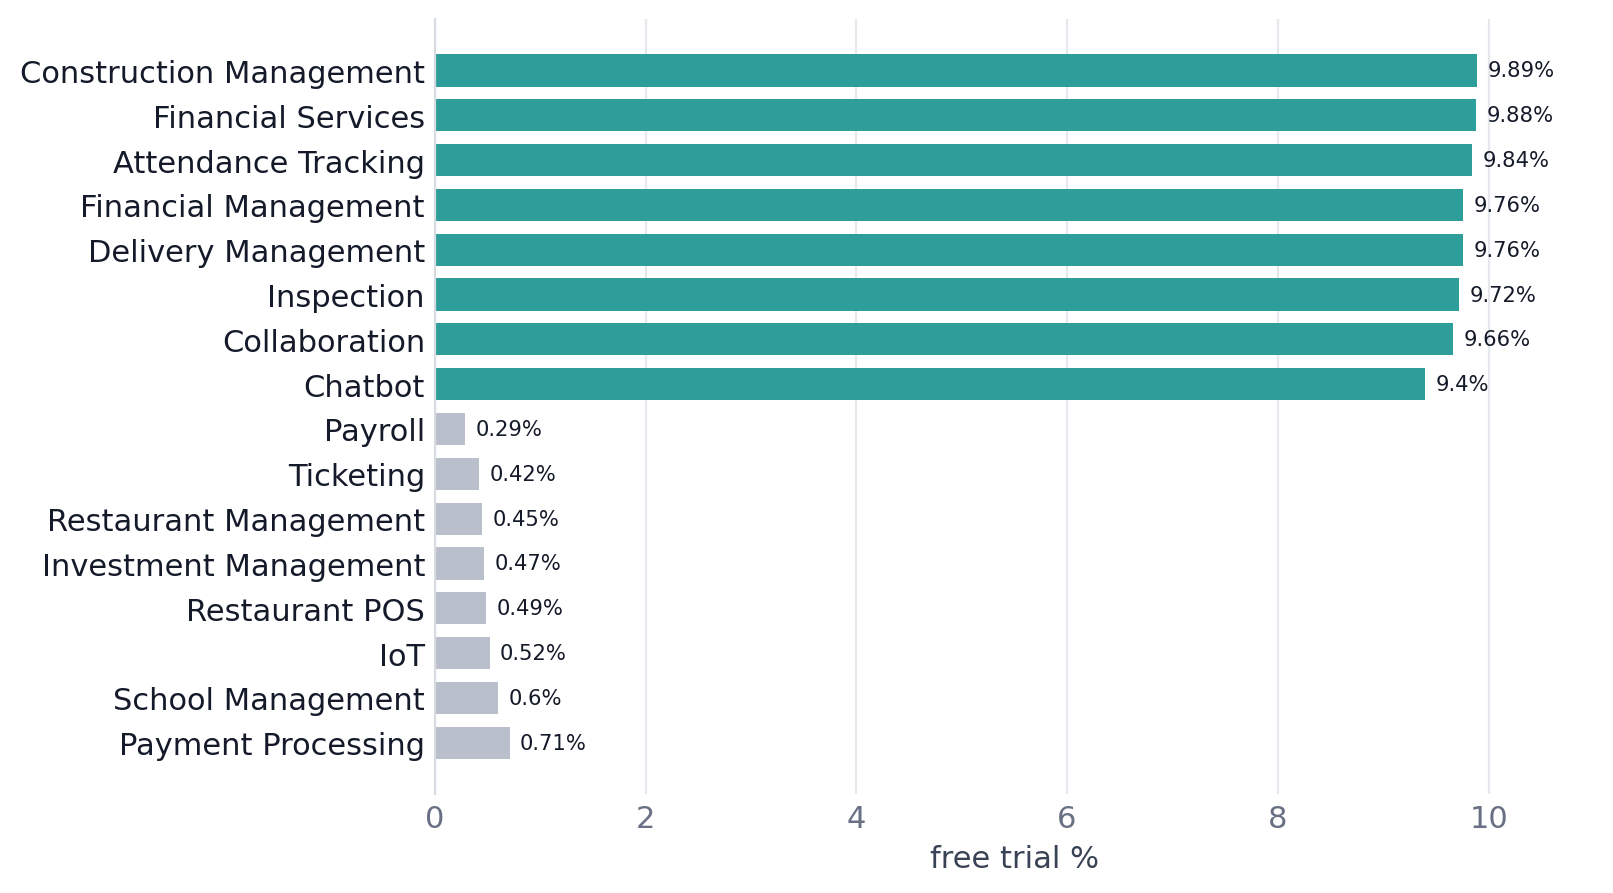
Selected recognizable higher-rate categories cluster around 9-10%, while the lower-rate examples range from 0.29% to 0.71%. These are selected category examples, not the complete ranking of all 645 categories.
Payroll, at 0.29%, is the lowest free-trial category in the report's listed ranking. Ticketing (0.42%) and Restaurant Management (0.45%) are also near the bottom. The selected higher-rate examples should not be described as the highest free-trial categories across the entire dataset. The source labels them recognizable examples, and it separately reports 30 categories at 100% free trial. The category-level median remains 7.41%.
Where is published monthly pricing least common?
The monthly-pricing table includes several categories with recorded rates near or below 1%. The following are selected examples from the report's lowest-rate ranking.
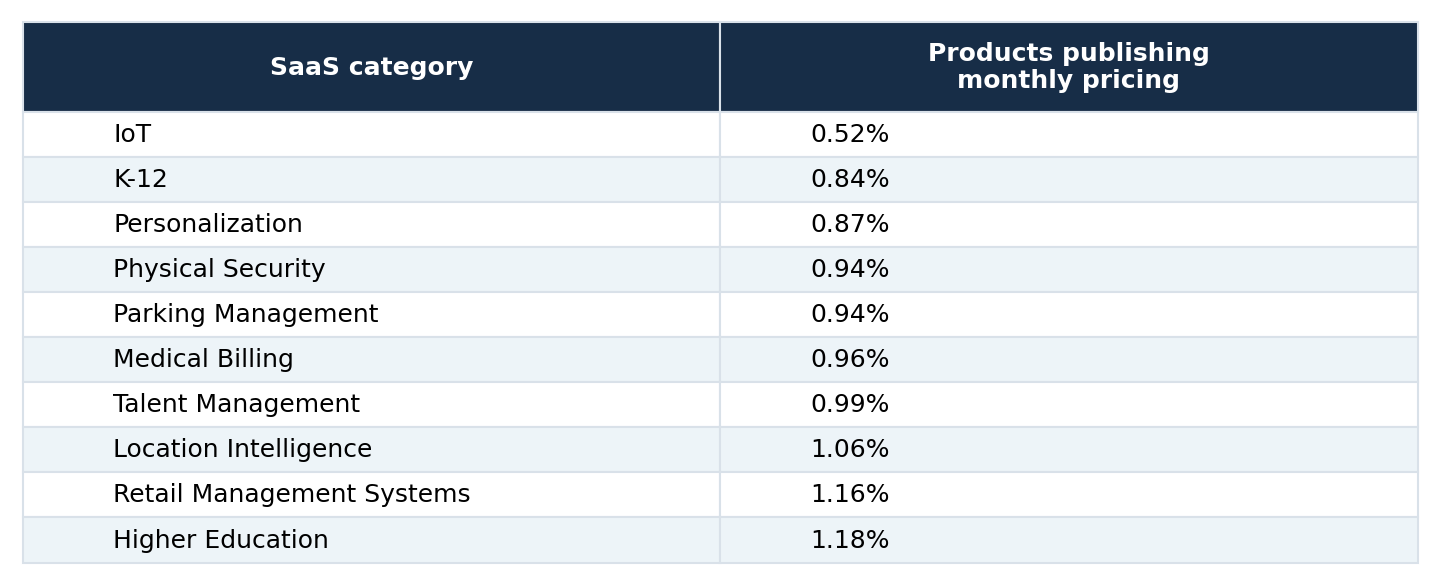
IoT has the lowest published monthly-pricing rate among the listed categories, at 0.52%. K-12 follows at 0.84%. Importantly, a low published monthly-pricing rate does not automatically mean that the category has a high quote-required rate. The measures are independent, and the report does not provide a product-level cross-tabulation showing how the signals overlap.
Which SaaS categories require quotes most and least often?
Several categories in the source are recorded at 100% quote-required, including Hospital EMR, Electronic Health System, KYC, Financial Close, LIMS, and Brokerage Management. They are examples from the report's 129 categories with that recorded rate. At the other end, Photo Editing records 1.10%, Oil and Gas 1.24%, and Tour Operator 1.36%.
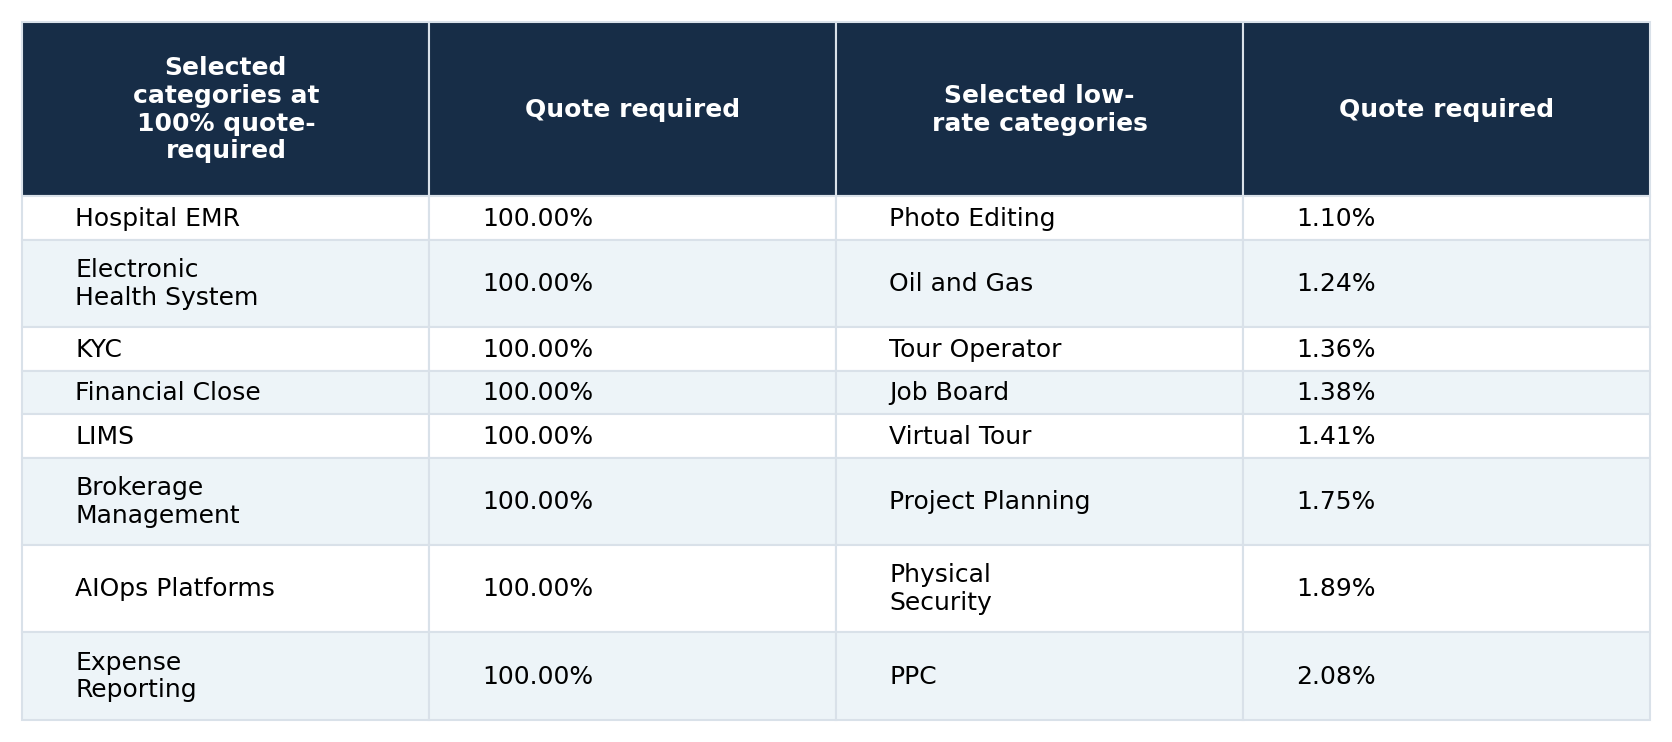
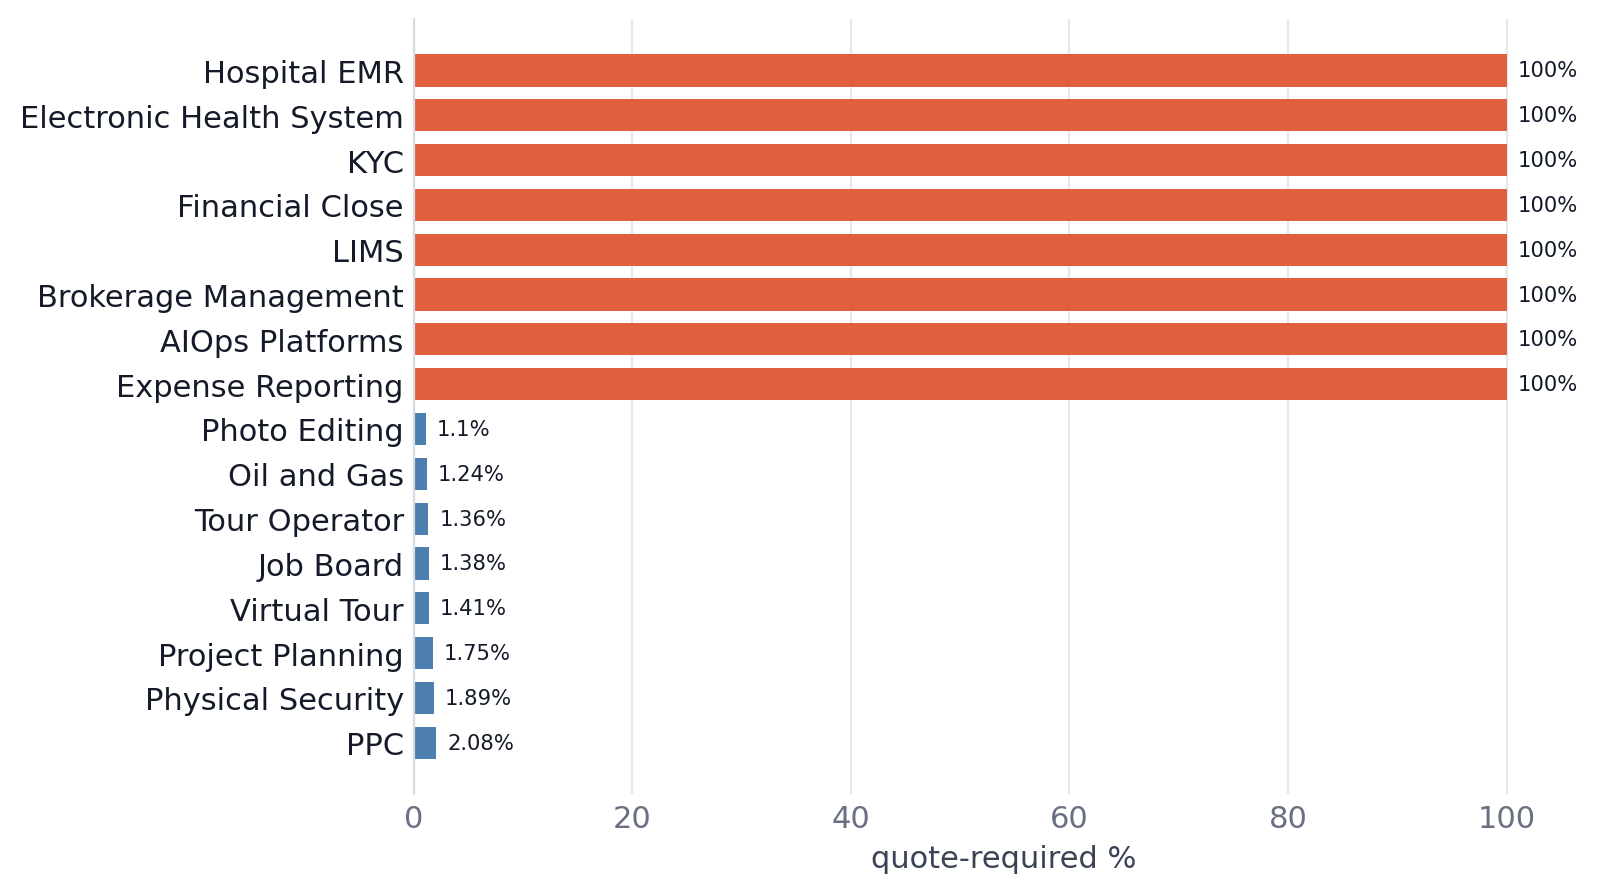
The source chart contrasts eight categories recorded at 100% quote-required with eight categories below 2.1%. The source does not disclose the number of products behind these percentages.
These results show how much recorded quote-required adoption can differ between categories. They do not explain why the differences occur. For instance, the unusually low 1.24% rate in Oil and Gas could reflect incomplete pricing information, as the source report cautions. Nor does a low quote-required percentage prove that most products publish prices. A listing may lack both a quote-required flag and a published monthly price.
What do these findings mean for SaaS buyers and vendors?
For buyers, the figures suggest that pricing information may be presented very differently across software categories. When evaluating an individual product, checking its current pricing page and trial terms is more informative than relying on a category average. For vendors, the analysis provides descriptive benchmarks for how frequently the three pricing signals appear in the catalog. It does not establish which approach increases conversion, revenue, or customer retention, nor does it identify the commercial reasons behind a category's pricing presentation.
For researchers, the central methodological lesson is that category-level percentages and product-level market shares are different measurements. Comparing the three headline medians is useful for describing the report's separate distributions, but it is not a product-weighted comparison over a common sample.
Methodology and data limitations
This analysis uses Solevant's SaaS Pricing Model Adoption by Category report. It compares three category-level tables covering quote-required status (941 categories), monthly pricing (799 categories), and free trials (645 categories). Underlying product records were not independently recalculated. Definition of rates: Each row represents a category and the percentage of its products with the specified pricing signal. Quote-required, published monthly pricing, and free-trial availability are measured separately. Different denominators: Only 581 categories occur in all three tables. The medians are calculated over different sets of categories and cannot be interpreted as a common product-level split.
Missing category product counts: The report does not provide the number of products in each category. Extreme rates such as 100% cannot be screened for small samples or weighted by category size. Incomplete or ambiguous listing information: A missing monthly-price signal is not necessarily a quote-required signal, and a low quote-required rate does not prove price transparency. The report also flags Oil and Gas as a possible incomplete-data case. No causal analysis: The figures do not establish why particular categories require quotes or offer trials, or whether a pricing presentation affects business outcomes.
No reporting period: A collection date, reporting period, and update frequency were not supplied. These are source-catalog observations, not verified current-year rates or a historical trend. Chart source: All four charts were extracted from the uploaded report. The quote-required histogram is retained from the source because exact histogram-bin counts are not listed in the text tables.
Frequently asked questions
What is the most common SaaS pricing signal in the report?
Quote-required has the highest median category adoption rate at 40.91%, compared with 12.90% for published monthly pricing and 7.41% for free trials. The three measures use different category samples.
What percentage of SaaS products publish monthly pricing?
The report does not provide a single product-weighted percentage for the entire catalog. It reports that 12.90% of products publish monthly pricing in the median category among the 799 categories measured.
How common are free trials across SaaS categories?
The median category-level free-trial rate is 7.41% across 645 categories. The middle half of categories falls between 3.57% and 15.15%.
Can a SaaS product have more than one pricing signal?
Yes. A product can require a quote for one plan, publish a monthly price for another, and offer a free trial. The three measures are not mutually exclusive.
Which SaaS categories are recorded at 100% quote-required?
Examples include Hospital EMR, Electronic Health System, KYC, Financial Close, LIMS, and Brokerage Management. The report lists 129 categories at 100%, but does not provide their product counts.
Which category has the lowest quote-required rate?
Photo Editing, at 1.10%, followed by Oil and Gas (1.24%) and Tour Operator (1.36%) in the source ranking.
Which category has the lowest free-trial rate?
Payroll, at 0.29% in the report's lowest-rate ranking. Ticketing is next at 0.42%.
Does this report compare SaaS subscription prices?
No. It compares the presence of pricing signals, not actual subscription amounts, average plan prices, or total cost of ownership.
Conclusion
Solevant's pricing-model analysis shows that quote-required pricing has a much higher median category rate than published monthly pricing or free-trial availability in the supplied catalog tables. The median category records 40.91% quote-required, 12.90% monthly pricing, and 7.41% free trial. But those figures come from different category sets, and the signals can overlap within individual products. The most useful conclusion is therefore a category-level pattern in pricing presentation, not a universal market share or proof of a commercial strategy. Understanding the denominators, missing product counts, and lack of a reporting period is essential to using these findings accurately.