
SaaS Naming Analysis: What 101,827 Product Names Reveal
What do SaaS companies put in their product names? Some names explicitly mention a software function, such as Cloud, CRM, or AI. Others use names that do not contain those particular words. Solevant's SaaS Naming Analysis examines 101,827 product names against a fixed list of 12 keywords. It then compares each keyword group's reported average monthly price, average integrations, and percentage of products marked Active. The most striking finding is that 92,939 names (91.27%) contain none of the 12 tested keywords. Just 8,888 names (8.73%) were assigned one of the keyword tags. Among those tags, Cloud is most common, while Marketing leads on recorded integrations and Finance has the highest reported average price.
These results describe associations in the Solevant catalog, not proof that choosing a keyword changes pricing, integrations, or business performance.
Key findings
- 101,827 SaaS product names were evaluated against 12 keywords.
- 92,939 names (91.27%) contain none of those keywords; 8,888 (8.73%) are keyword-tagged.
- Cloud (1,598) is the most common tested keyword, followed by Management (1,454) and System (1,177).
- Finance has the highest reported average monthly price at $11,916.67, but the tag contains just 71 products, and prices are not currency-normalized.
- AI ($3,089.18) and Data ($2,186.98) also have high reported price averages compared with the Other baseline ($329.68).
- Marketing leads average recorded integrations at 12.96; Health is lowest at 0.81.
- The percentage marked Active ranges from 79.86% for HR to 88.02% for Marketing, compared with 83.39% for Other.
What does a naming keyword mean in this study?
The research checks names for Cloud, Management, System, AI, Data, CRM, HR, Sales, Health, BI, Marketing, and Finance. Each product is placed into a keyword group according to the source's tagging rule. When a name contains more than one tested keyword, the report says the source assigns a single tag, but does not specify the precedence rule. Names without any of the 12 keywords are classified as Other. The report describes these as brand-first names. That is a convenient shorthand, but it has an important limitation: Other does not necessarily mean a name is purely a brand name. It may contain descriptive words that simply were not among the 12 tested. The analysis therefore measures the frequency of these specific keywords, not the full prevalence of descriptive SaaS naming.
How many SaaS names include a category keyword?
Only 8.73% of the 101,827 product names fall into one of the 12 keyword groups. The remaining 91.27% are in Other. Within the keyword-tagged subset, Cloud, Management, and System account for the largest groups. Finance and Marketing are the smallest.
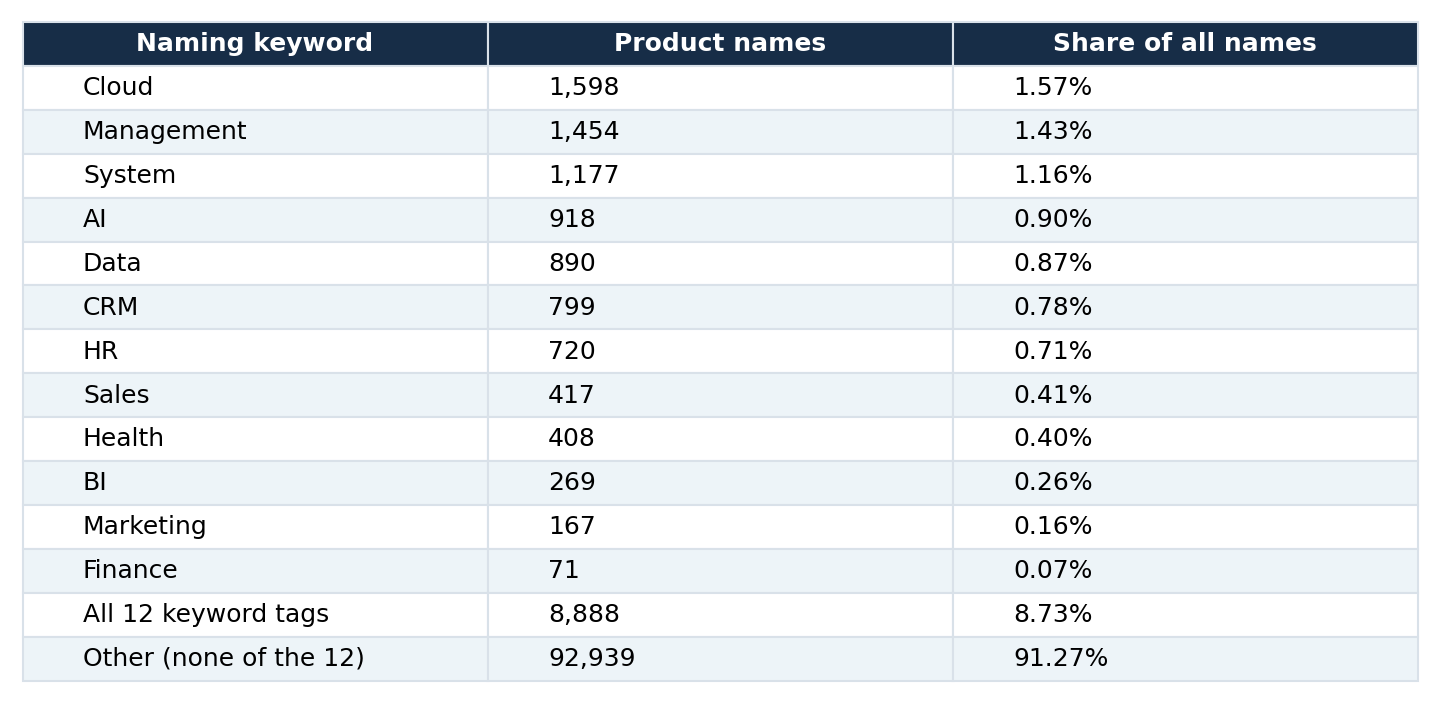
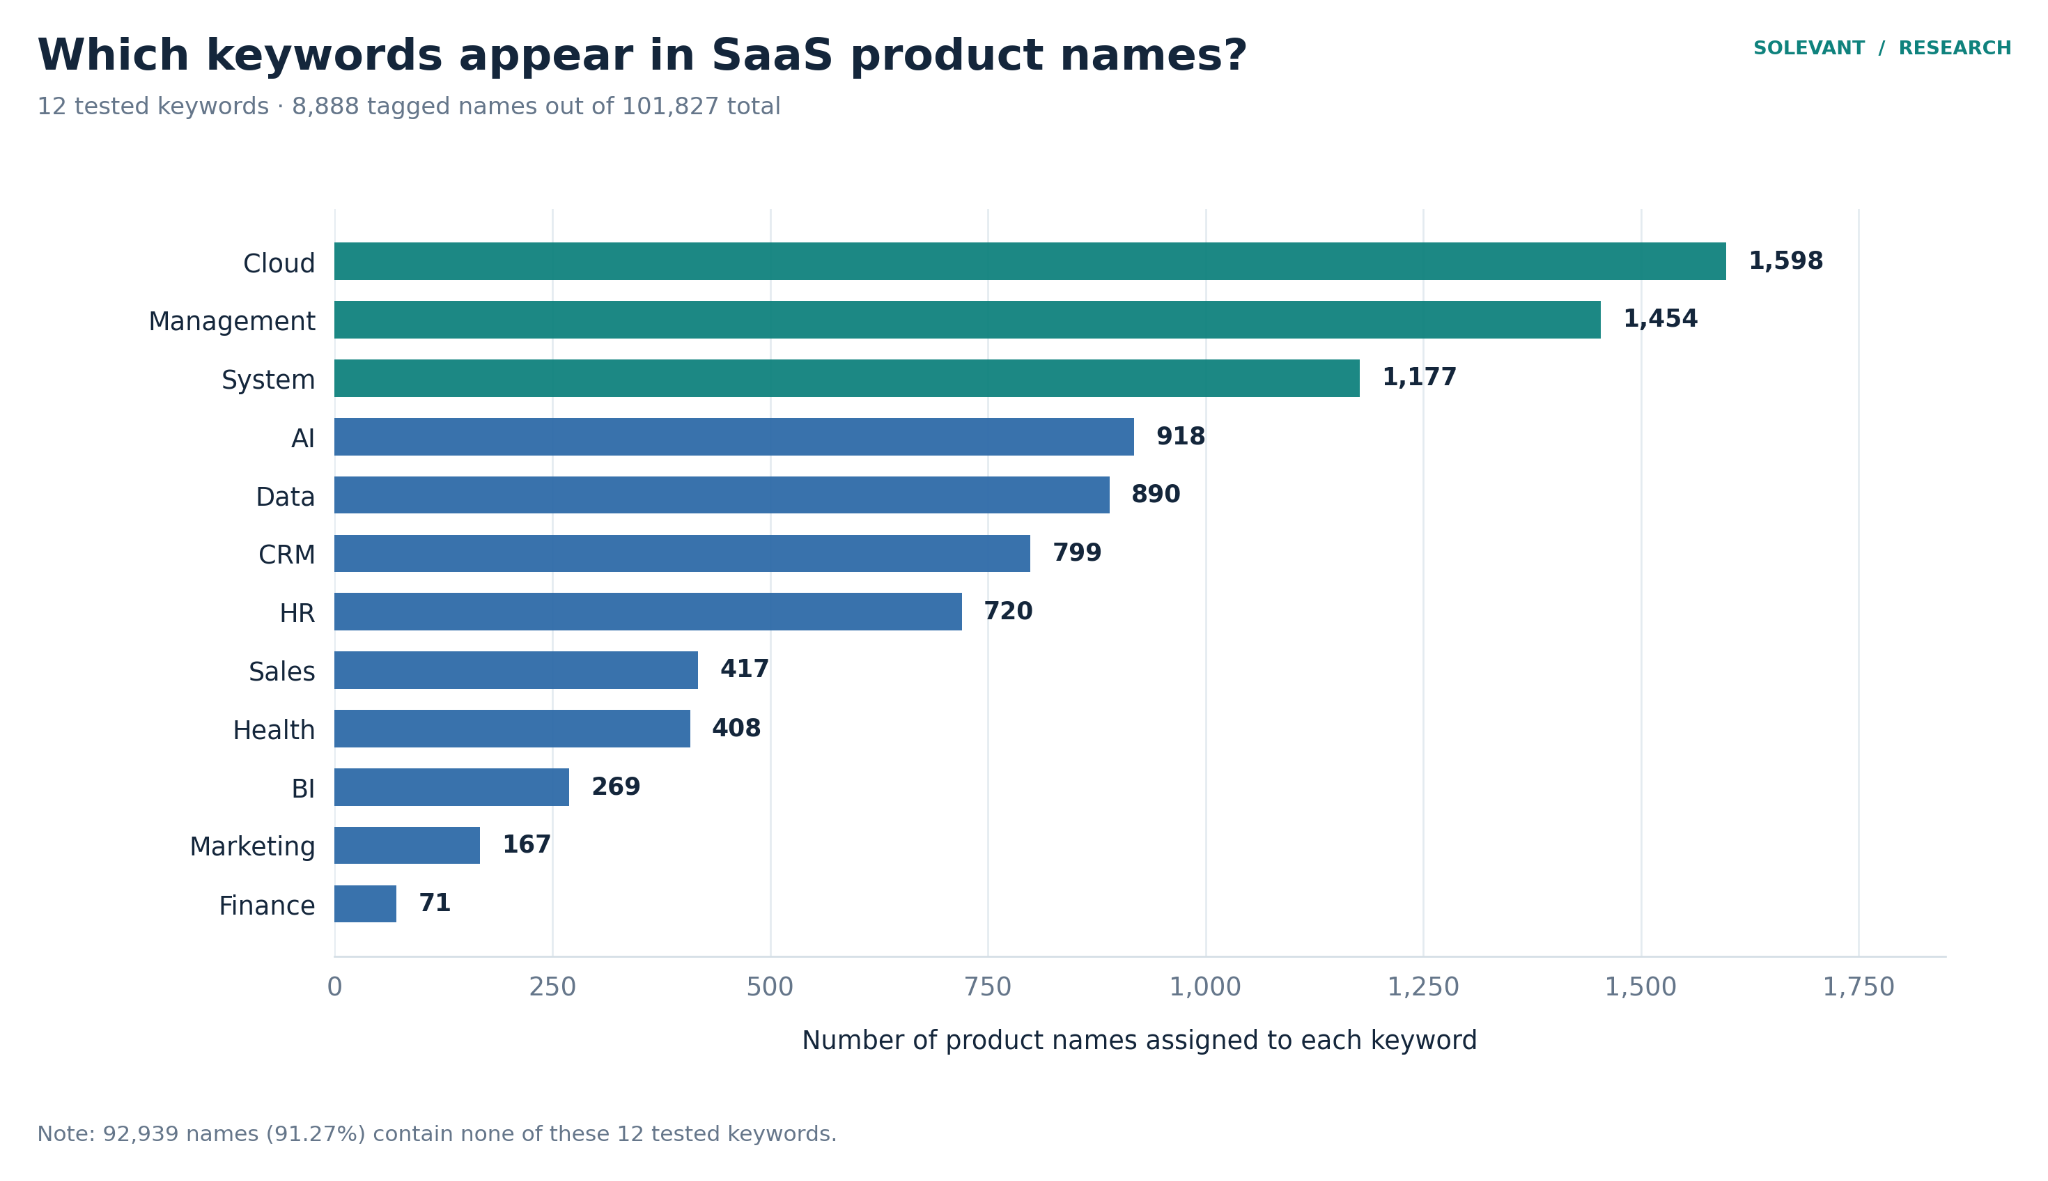
Cloud appears in 1,598 assigned product names, followed by Management (1,454) and System (1,177). The 92,939 names in Other are excluded from the chart so the smaller keyword groups remain visible.
Cloud appears in 1.57% of all product names, making it the leading tested keyword but still a small part of the catalog. The chart should not be read as a count of every name containing the string Cloud if some names matched multiple keywords; it represents the source's assigned tags.
Do SaaS naming keywords correspond to different average prices?
The report shows wide differences in reported average monthly prices by naming tag. Finance leads at $11,916.67, followed by AI at $3,089.18 and Data at $2,186.98. The Other group has a reported average of $329.68. At the low end, System averages $144.66, Marketing $210.71, and CRM $221.22.
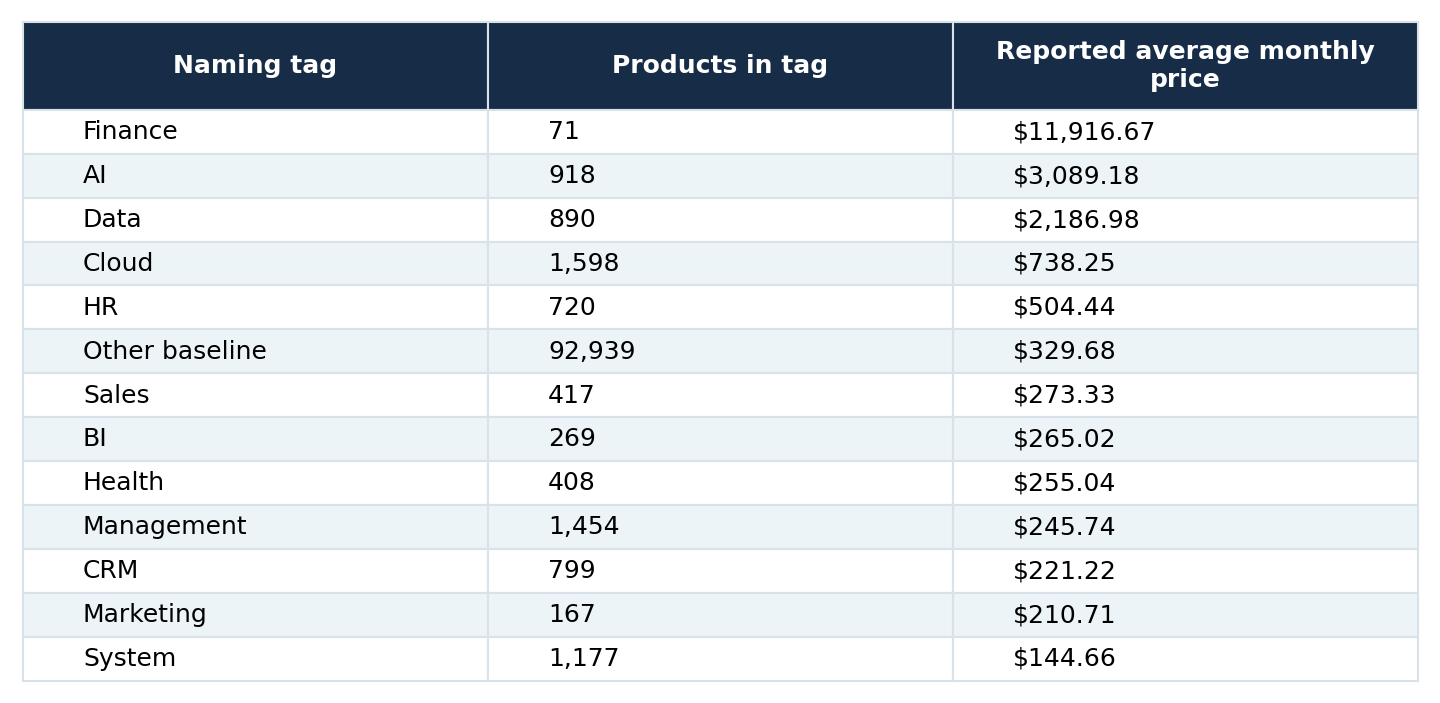
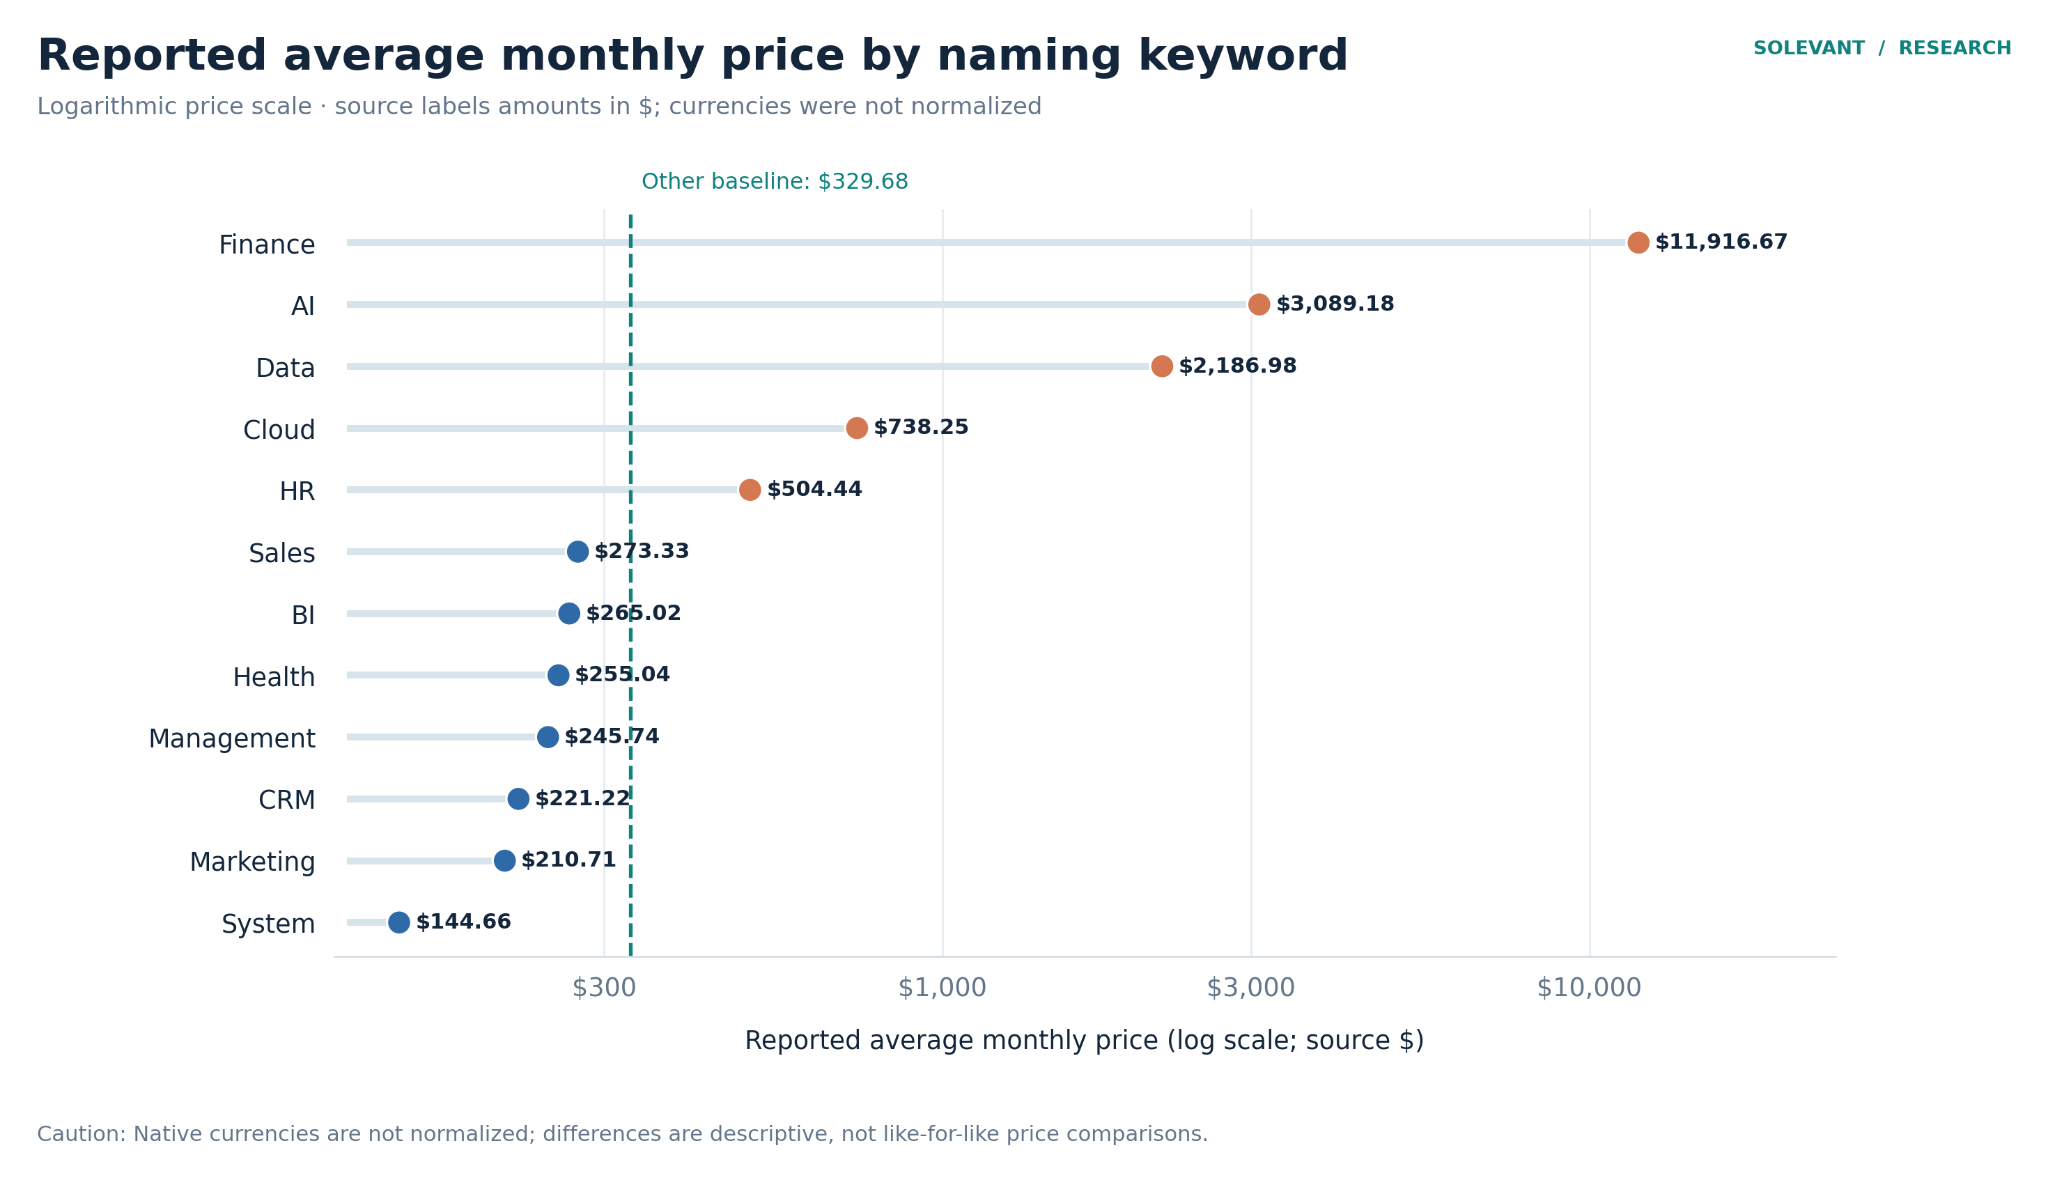
Finance, AI, and Data have the highest reported price averages. A logarithmic scale accommodates the wide range. Source prices are labeled in dollars but are not normalized across native currencies.
Why the price differences require caution
These are not reliable like-for-like global price comparisons. The report says prices come from listings in their native currencies and were not currency-normalized. The source displays dollar signs, but does not establish that all underlying amounts represent equivalent USD prices. The report also does not provide the number of priced products behind each tag's average. Finance contains 71 products in total, but that is not necessarily 71 usable price observations. A few high-price entries could have a large effect on its mean.
Consequently, the analysis supports the observation that reported averages differ by naming tag. It does not establish that including Finance or AI in a product name allows a vendor to charge more, or that the tags identify comparable product tiers.
Which naming keywords have the most integrations?
The relationship between names and recorded integrations looks different from the price ranking. Marketing leads with 12.96 average integrations per product, followed by Data (9.41), CRM (7.55), and Sales (6.16). These all exceed the Other baseline of 4.96. At the opposite end, Health averages 0.81, System 1.50, and HR 2.07.
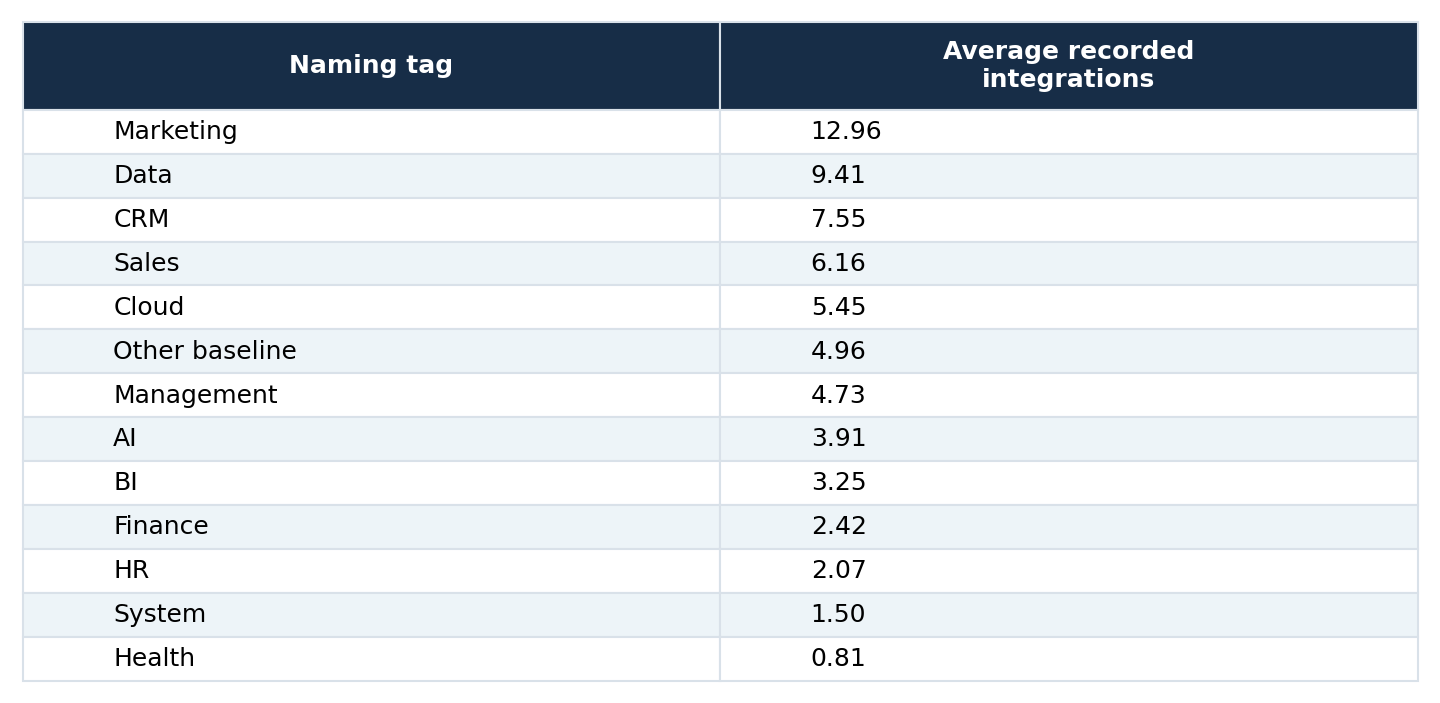
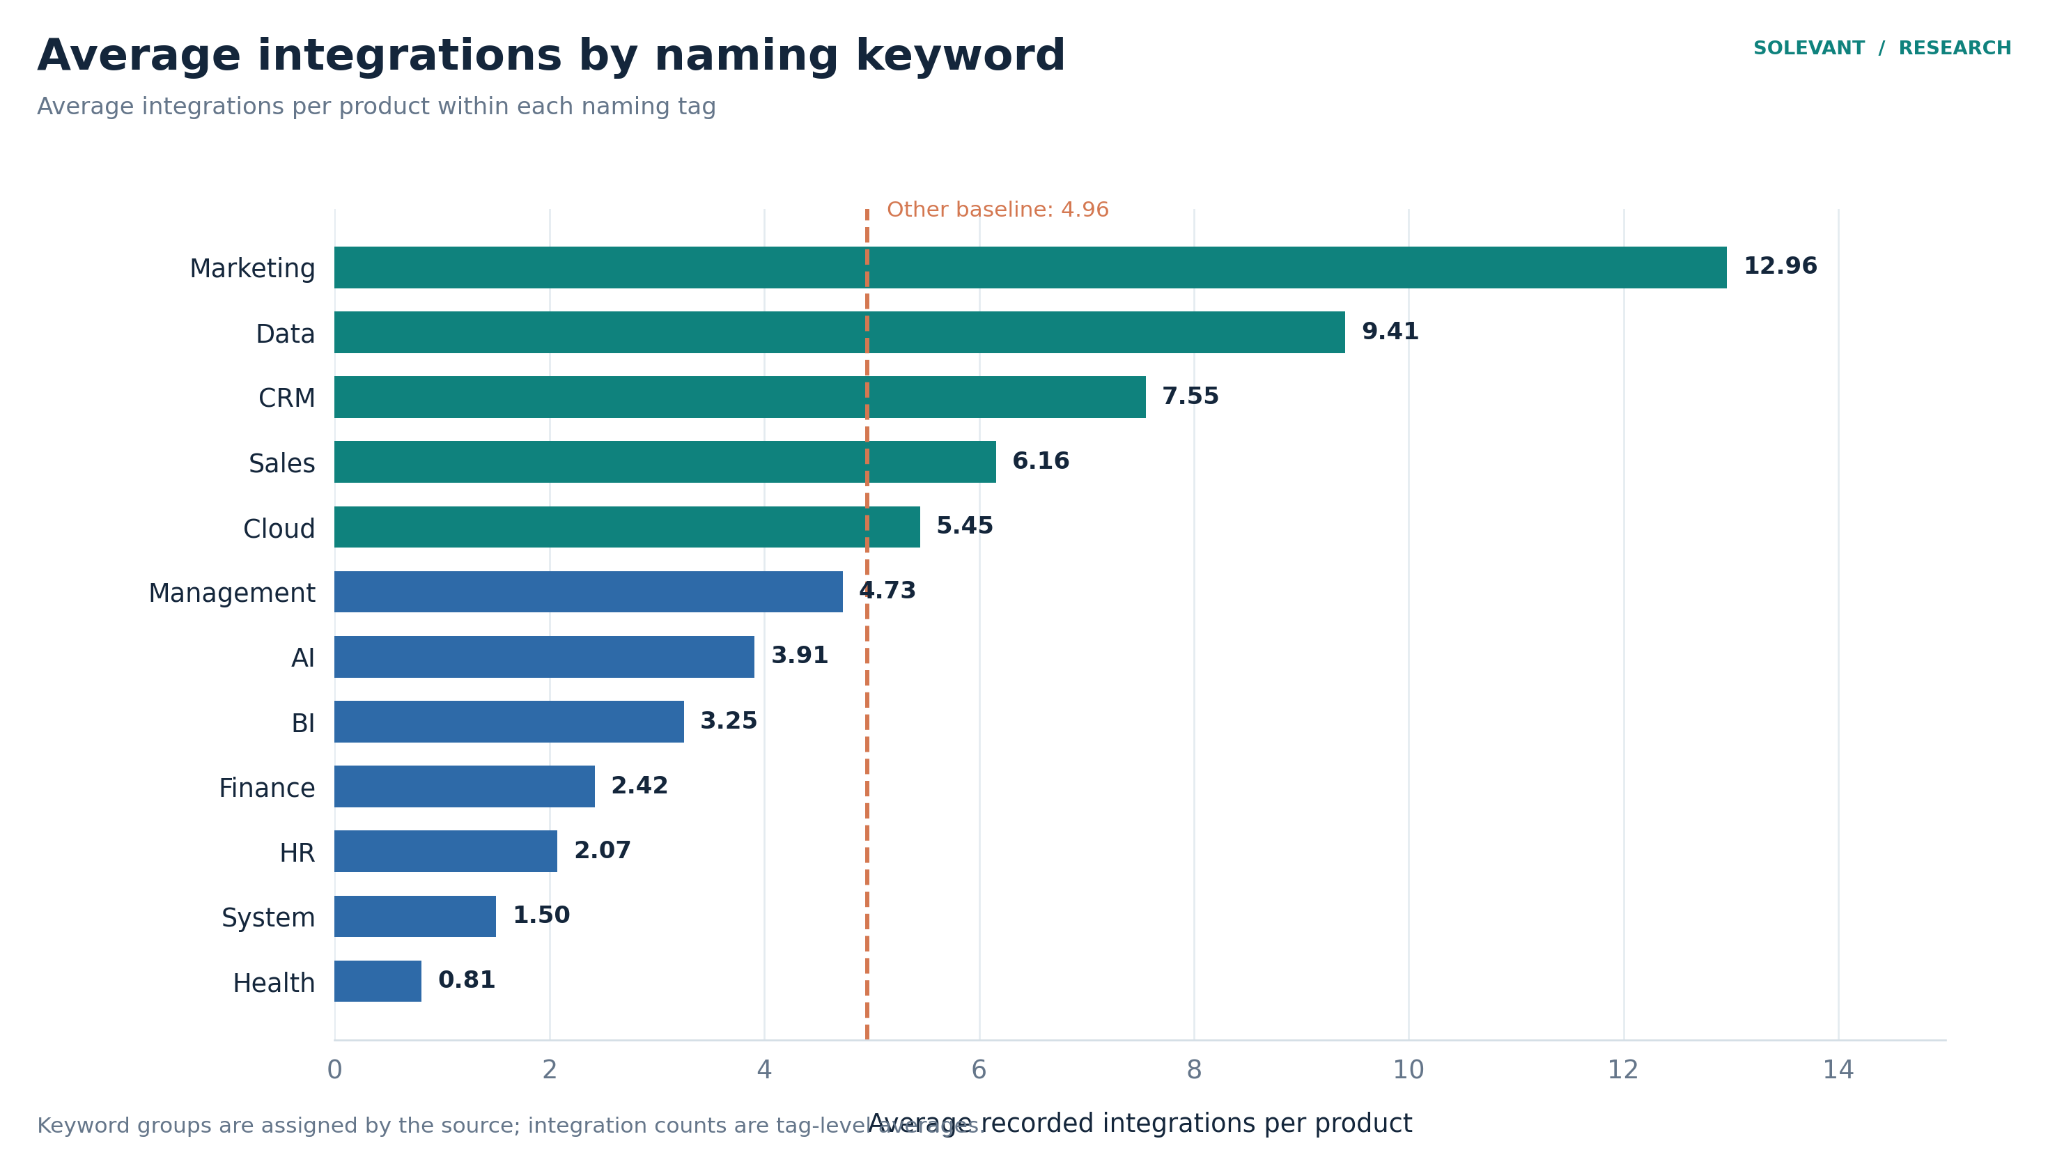
Marketing-tagged names lead at 12.96 recorded integrations per product, compared with 4.96 for the Other group. Health is lowest at 0.81.
Marketing, Data, CRM, and Sales are associated with higher recorded integration averages in this sample. The report describes these as broadly applicable business functions, while some lower-integration tags are more specialized. That pattern is descriptive: the naming data does not establish why a product has more or fewer integrations. A keyword in a name is also not a substitute for checking a specific product's supported connections. The figures are averages across assigned tags, not guaranteed capabilities of every product.
Are products with certain keywords more likely to be active?
The report also compares the percentage of products marked Active within each naming tag. Unlike reported price and integration averages, these percentages occupy a relatively narrow range. Marketing has the highest active share at 88.02%, while HR is lowest at 79.86%. The Other baseline is 83.39%. Most keyword groups lie near that baseline.
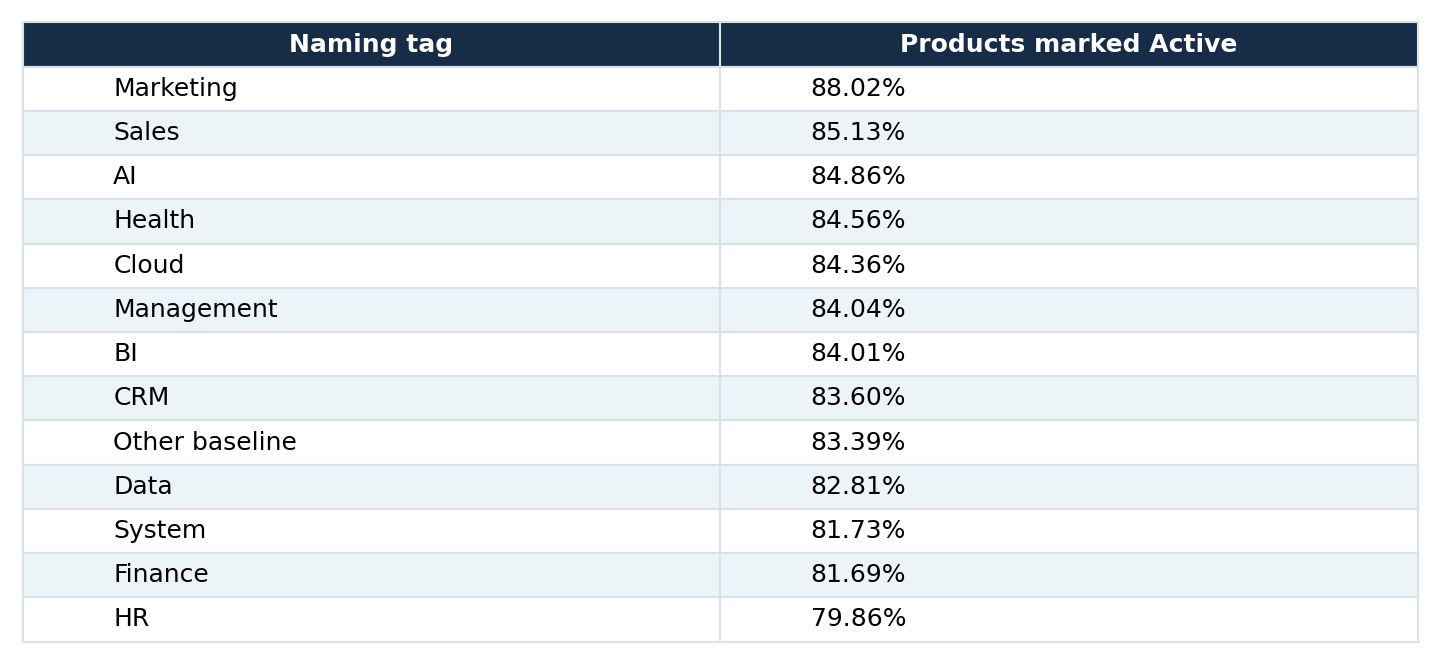
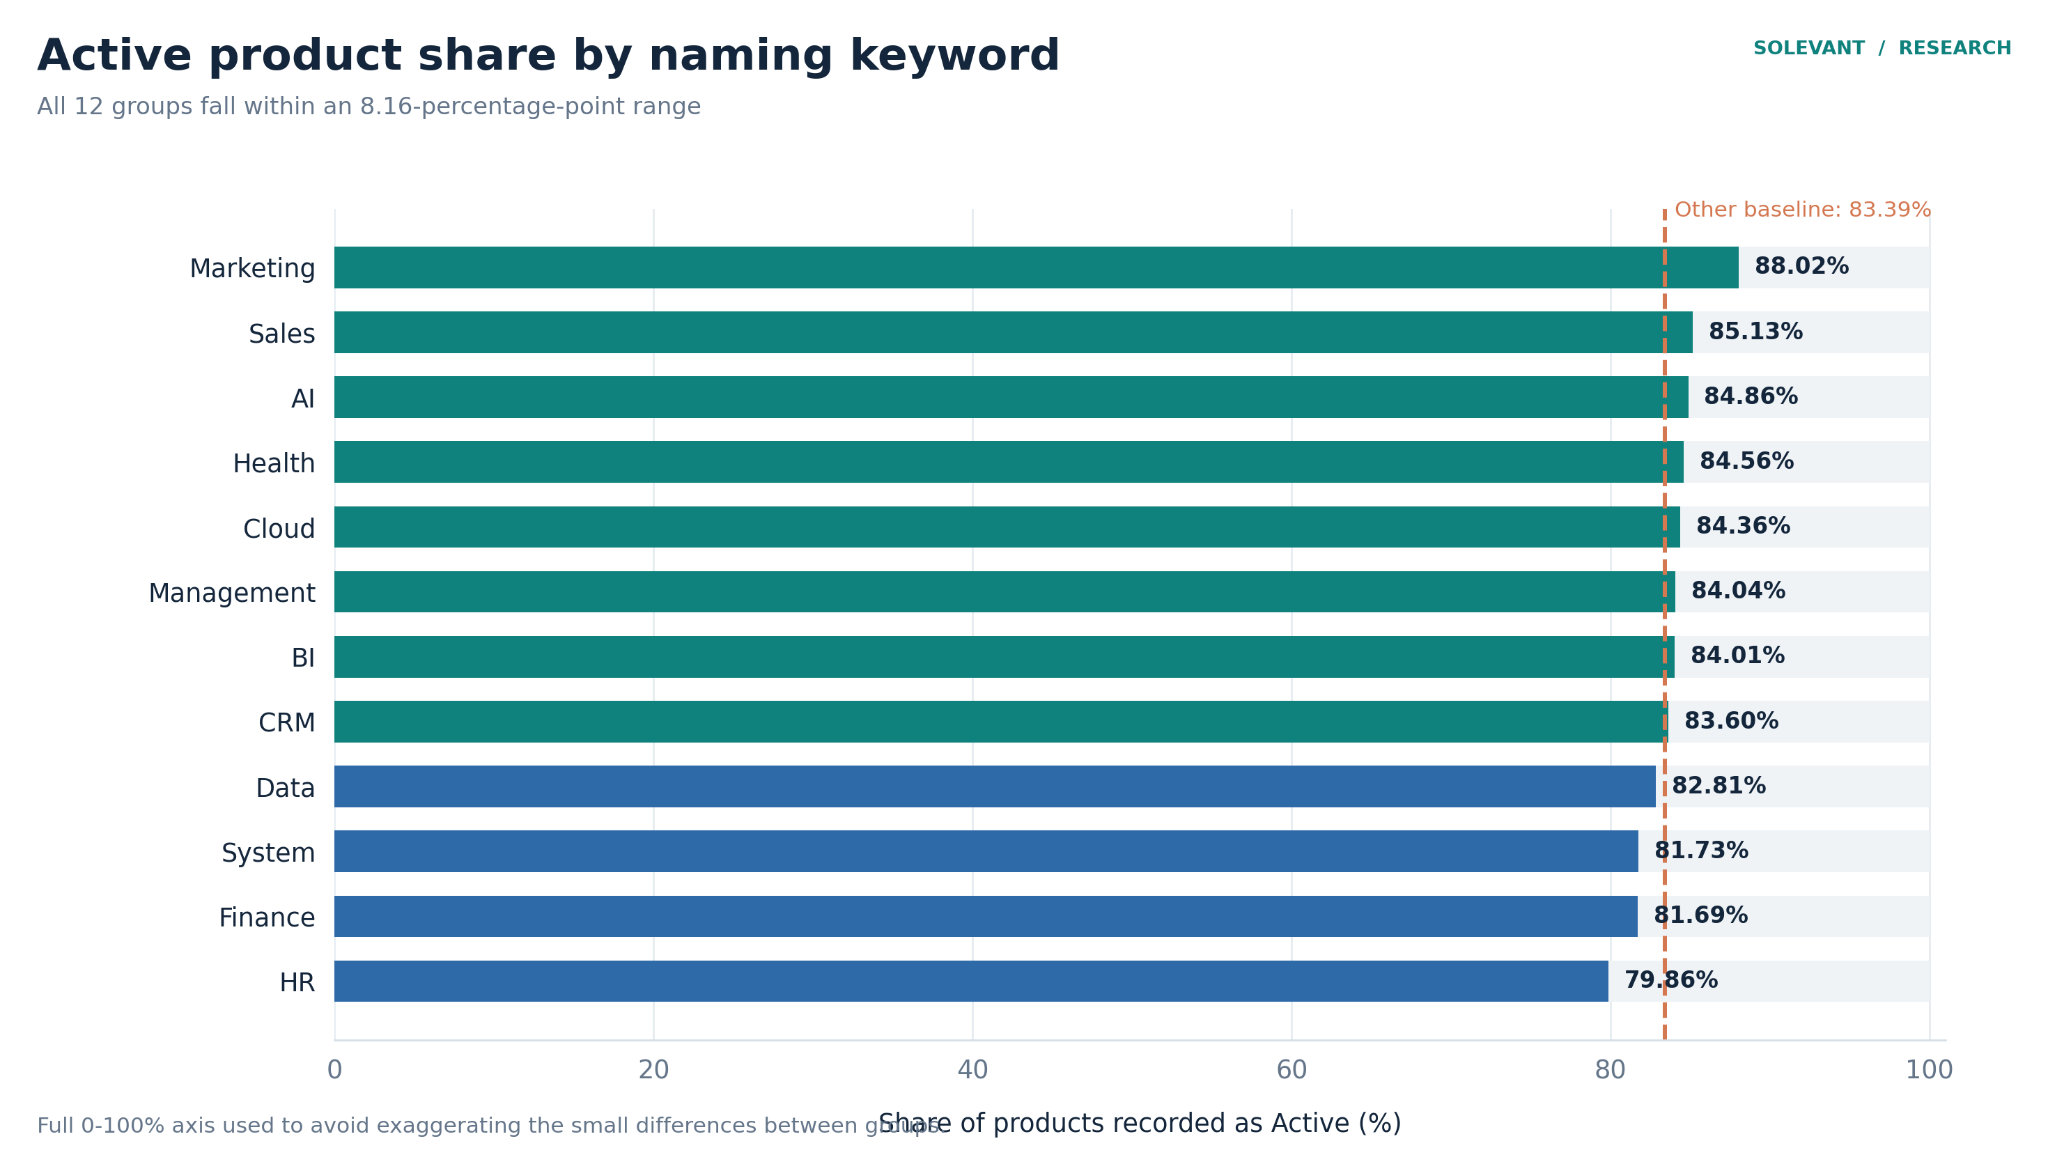
Active shares range from 79.86% to 88.02% across the 12 keyword groups. The chart uses a full 0–100% scale to show that the differences are modest.
The spread between the highest and lowest keyword groups is 8.16 percentage points. These are descriptive status proportions, not a measured product survival rate: the source provides no observation period or launch-date adjustment. It would therefore be misleading to conclude that using Marketing in a name increases a product's chance of remaining active, or that HR naming harms it.
What can SaaS founders and buyers learn from these results?
For founders, the report illustrates the variety of naming styles represented in the catalog. Most product names do not contain the 12 tested keywords, while a smaller subset explicitly includes terms such as Cloud, CRM, or AI. The data does not identify which naming style performs better in search, sales, memorability, or customer acquisition. For buyers, a keyword may provide a quick clue about a product's positioning, but it does not verify its software category, capabilities, or integration quality. A name containing AI does not establish how the product uses artificial intelligence, just as a name containing CRM does not establish that the product belongs to the catalog's CRM category.
For analysts, the findings show why a naming keyword should be treated as one catalog attribute, not as an explanation for pricing or operational status. The large Other group also means a fixed keyword list captures only a limited portion of naming language.
Methodology and limitations
This analysis uses Solevant's SaaS Naming Analysis report. Its naming summary contains keyword-group counts, price averages and integration averages, while its status summary compares product status by keyword group. The figures are reproduced from the research report; underlying product-level records were not independently recalculated. Important limitations include: Fixed keyword list: Only 12 keywords are tested. Other can contain descriptive words outside this list; it should not be interpreted as exclusively invented brand names.
Overlapping matches: The source assigns one keyword tag when a name matches more than one, but its precedence rule is not supplied. Price comparability: Reported monthly prices use native listing currencies and are not currency-normalized. Averages can also be distorted by outliers, and per-tag priced-product counts are not given. Status interpretation: Active shares describe recorded status, not a time-adjusted survival probability. Category matching: The report says a third workbook sheet used for matching name keywords to software categories is truncated to 1,000 rows. It therefore excludes purported name-to-category match rates from the verified findings.
No reporting period: Neither the collection date nor update frequency is provided. The figures should not be described as a current-year census or a historical trend.
Frequently asked questions
How many SaaS product names were analyzed?
101,827 product names were analyzed against 12 naming keywords in Solevant's catalog.
What percentage contain one of the tested keywords?
8,888 names (8.73%) were assigned one of the 12 tags. The other 92,939 (91.27%) contain none of those tested keywords.
What is the most common SaaS naming keyword?
Cloud, with 1,598 assigned product names, followed by Management (1,454) and System (1,177).
Which naming keyword has the highest reported average price?
Finance, at $11,916.67, based on a tag containing 71 products. The underlying prices are not currency-normalized, and the number of priced observations is not supplied.
Which keyword has the lowest reported average price?
System, at $144.66, compared with the Other baseline of $329.68. These figures should not be treated as normalized global USD prices.
Which keyword group has the most integrations?
Marketing averages 12.96 recorded integrations per product, followed by Data (9.41) and CRM (7.55).
Does a naming keyword predict whether a product is active?
The active shares are relatively close, ranging from 79.86% for HR to 88.02% for Marketing. The report does not establish a causal or predictive relationship.
Does including CRM or AI in a name mean the product belongs to that category?
Not necessarily. The report does not provide a reliable full-catalog name-to-category match rate because the relevant cross-tabulation is truncated.
Conclusion
The most important result from Solevant's naming analysis is not the popularity of any single term. It is that 91.27% of 101,827 product names contain none of the 12 keywords tested. Cloud, Management, and System lead the smaller keyword-tagged group, but even Cloud appears in only 1.57% of all names. Reported price averages and integration counts vary substantially between tags. Yet the active-status shares are comparatively close, and none of these associations establishes that the words in a product name cause a difference in price, functionality, or longevity.
The findings offer a useful snapshot of how these 12 terms appear in a large SaaS catalog, provided the keyword scope, non-normalized prices, and missing reporting period remain clear.