
Are New SaaS Products Launching with Fewer Integrations? A 2005–2025 Analysis
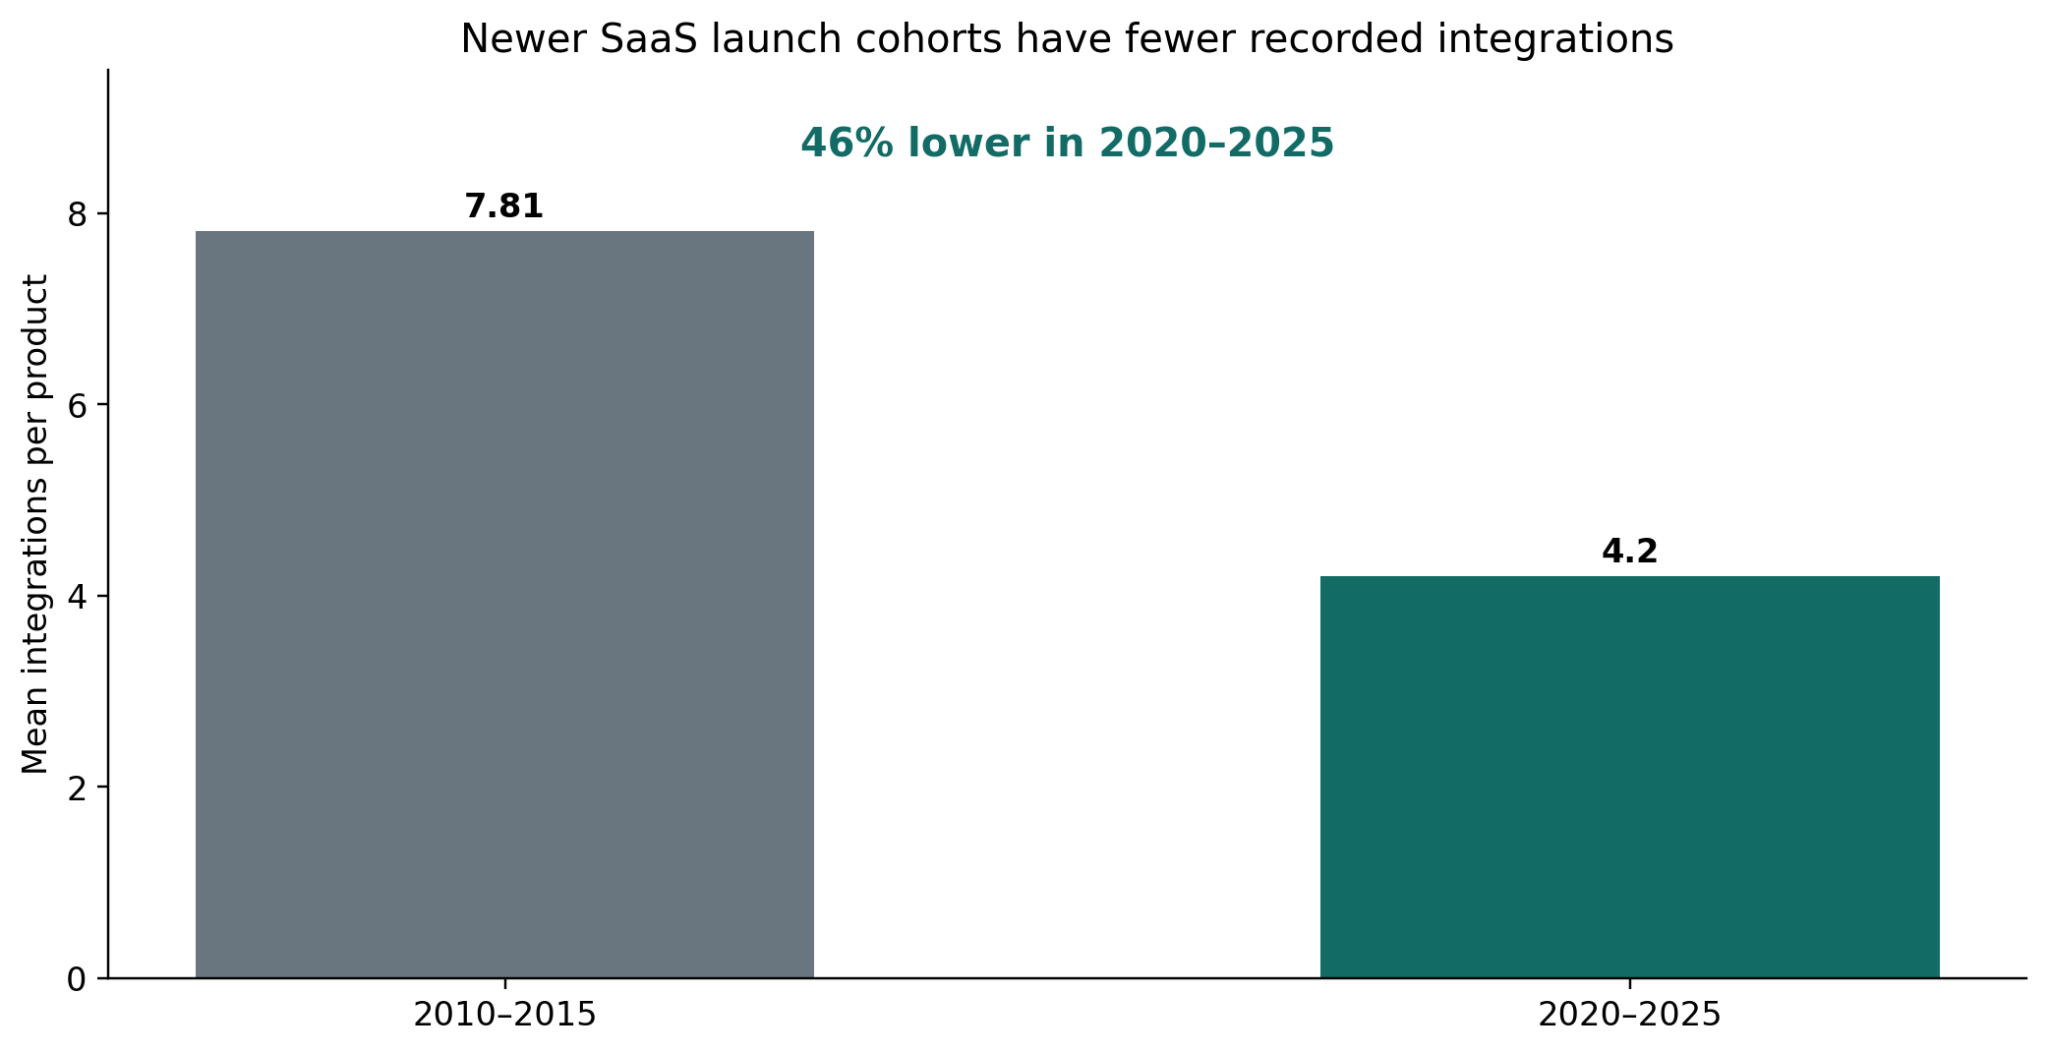
Products launched in 2020–2025 average 4.2 recorded integrations in Solevant’s catalog, compared with 7.81 for 2010–2015 launches—approximately 46% fewer. Among products launched between 2005 and 2025, the highest size-weighted launch-era average belongs to 2010–2013. But there is a crucial definition behind the headline: “features” means recorded integrations—connections to other tools and platforms—not the total number of capabilities, screens, automations or workflows a SaaS product offers. The data can show differences in integration breadth; it cannot establish whether newer software is simpler or more useful overall.
The report also finds little relationship between integration breadth and typical published price. Across six integration tiers, median prices range from $52.92 to $67.84, while the across-category correlation between average integrations and average price is r = −0.06.
Key findings
- 4.2 versus 7.81 integrations: The 2020–2025 cohort averages about 46% fewer integrations than the 2010–2015 cohort.
- 8.87 versus 3.66: The report's size-weighted 2010–2013 launch-era average is the highest of five eras; 2021–2025 is the lowest, approximately 59% below it.
- A lean median: In 20 of 21 launch years, the median product has zero or one integration; the exception is 2012, with a median of two.
- Similar cohort pricing: The median published prices are $54.90 for 2020–2025 launches and $55.00 for 2010–2015 launches, a $0.10 difference.
- Small category-level correlation: Across 122 categories, average integration count and average price have a reported correlation of −0.06.
- Category matters: Lead Generation averages 21.2 integrations, while Telemedicine averages 0.4.
- Active status is nearly flat: Active-status shares range from 98.92% to 99.15% across six integration tiers. This is not a longitudinal product survival measure.
How have SaaS integration counts changed by launch year?
The report tracks 21 launch-year cohorts, from 2005 through 2025. Average integration counts rise unevenly through the 2000s and early 2010s, with a pronounced 13.3 average in 2011. After a secondary high of 8.7 in 2018, averages decline to 5.5 in 2019, 5.1 in 2020, 4.2 in 2021, 3.7 in 2022, 2.5 in 2023 and 2.4 in 2024, before reaching 3.1 in 2025.
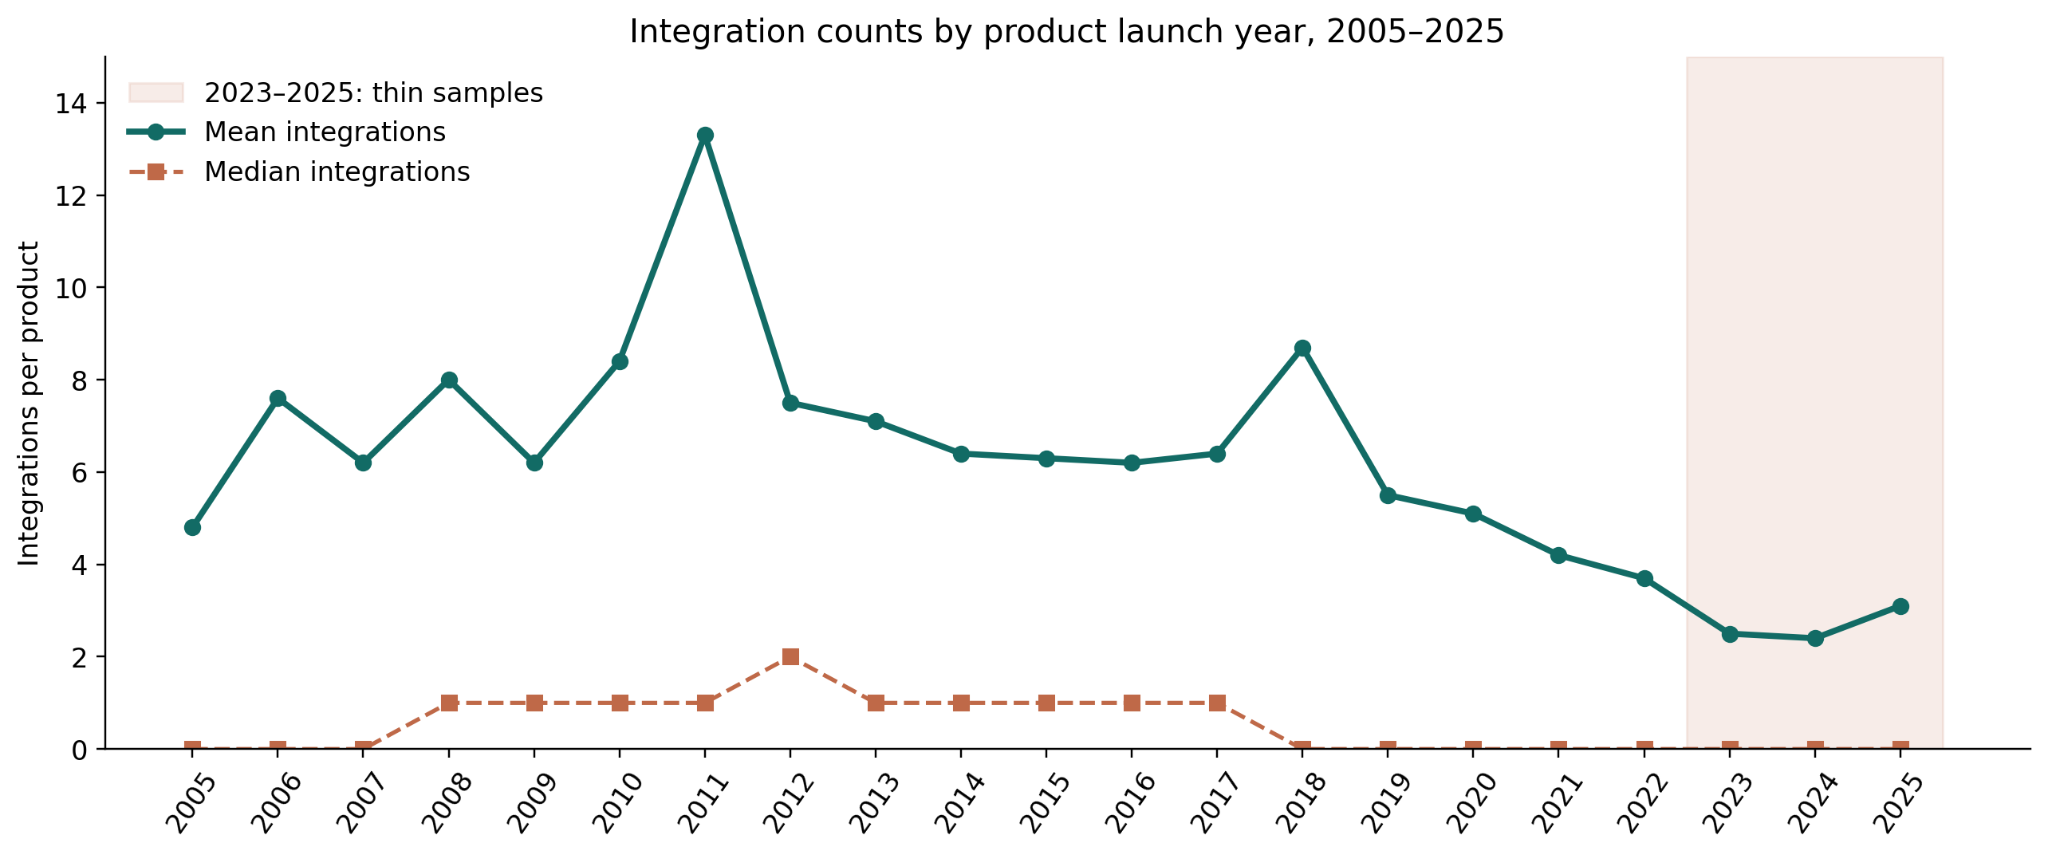
The median tells a different story from the average. Twenty of the 21 annual cohorts have a median of no more than one integration. In 2012, the median reaches two. This means the relatively high averages in some launch years reflect products in the upper tail of integration counts, rather than a typical SaaS listing carrying a large integration ecosystem. The newest years deserve special caution. The source lists only 466 products launched in 2023, 110 in 2024 and 27 in 2025, compared with hundreds or thousands in most earlier cohorts.
New products can take time to enter a directory, and their integration catalogs can grow after launch. The apparent recent decline is therefore descriptive of the catalog snapshot, not proof of an industry-wide design shift.
Are newer SaaS products leaner than older ones?
The report compares two named groups: New Wave (2020–2025), containing 4,232 products, and Old Guard (2010–2015), containing 9,023.
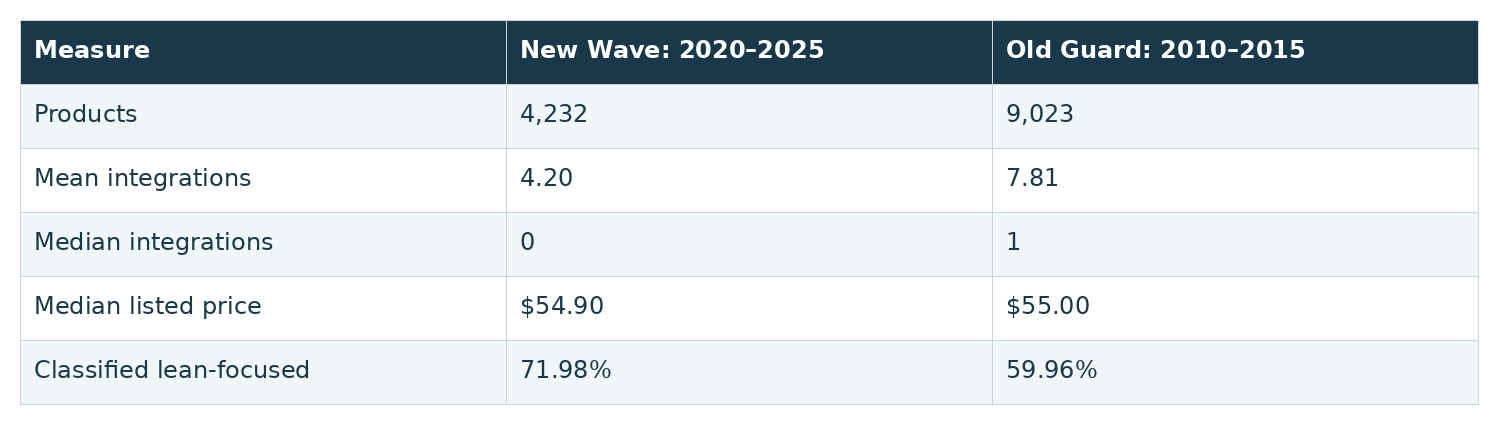
The New Wave group also has a 12.02-percentage-point higher lean-focused share, as classified by the report. However, the report does not provide the record-level rules used to classify every product as lean-focused, so the category should not be independently reconstructed from the summary alone. The data cannot isolate why younger cohorts have fewer integrations. Products launched a decade earlier have had more time to build connectors, but differences in product category, directory coverage and integration-count reporting may also matter. The report notes that the oldest cohort does not have the highest mean, suggesting product age alone may not explain the entire pattern. That observation is useful, but it is not a controlled test of product-design strategy.
Do SaaS products with more integrations charge more?
The median price changes only modestly across the six integration tiers shown in the source. Listings with zero integrations have a median price of $52.92; those in the 20+ tier have a median of $63.33, a difference of $10.41. The highest tier median in the table is $67.84 for 11–20 integrations, so the pattern is not strictly increasing.
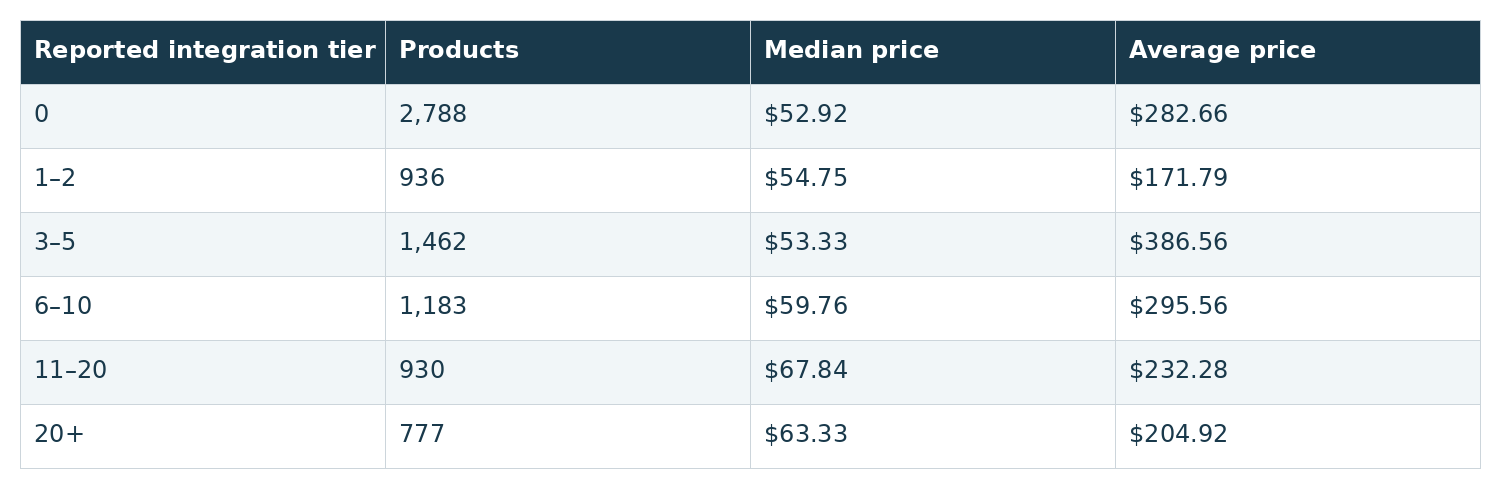
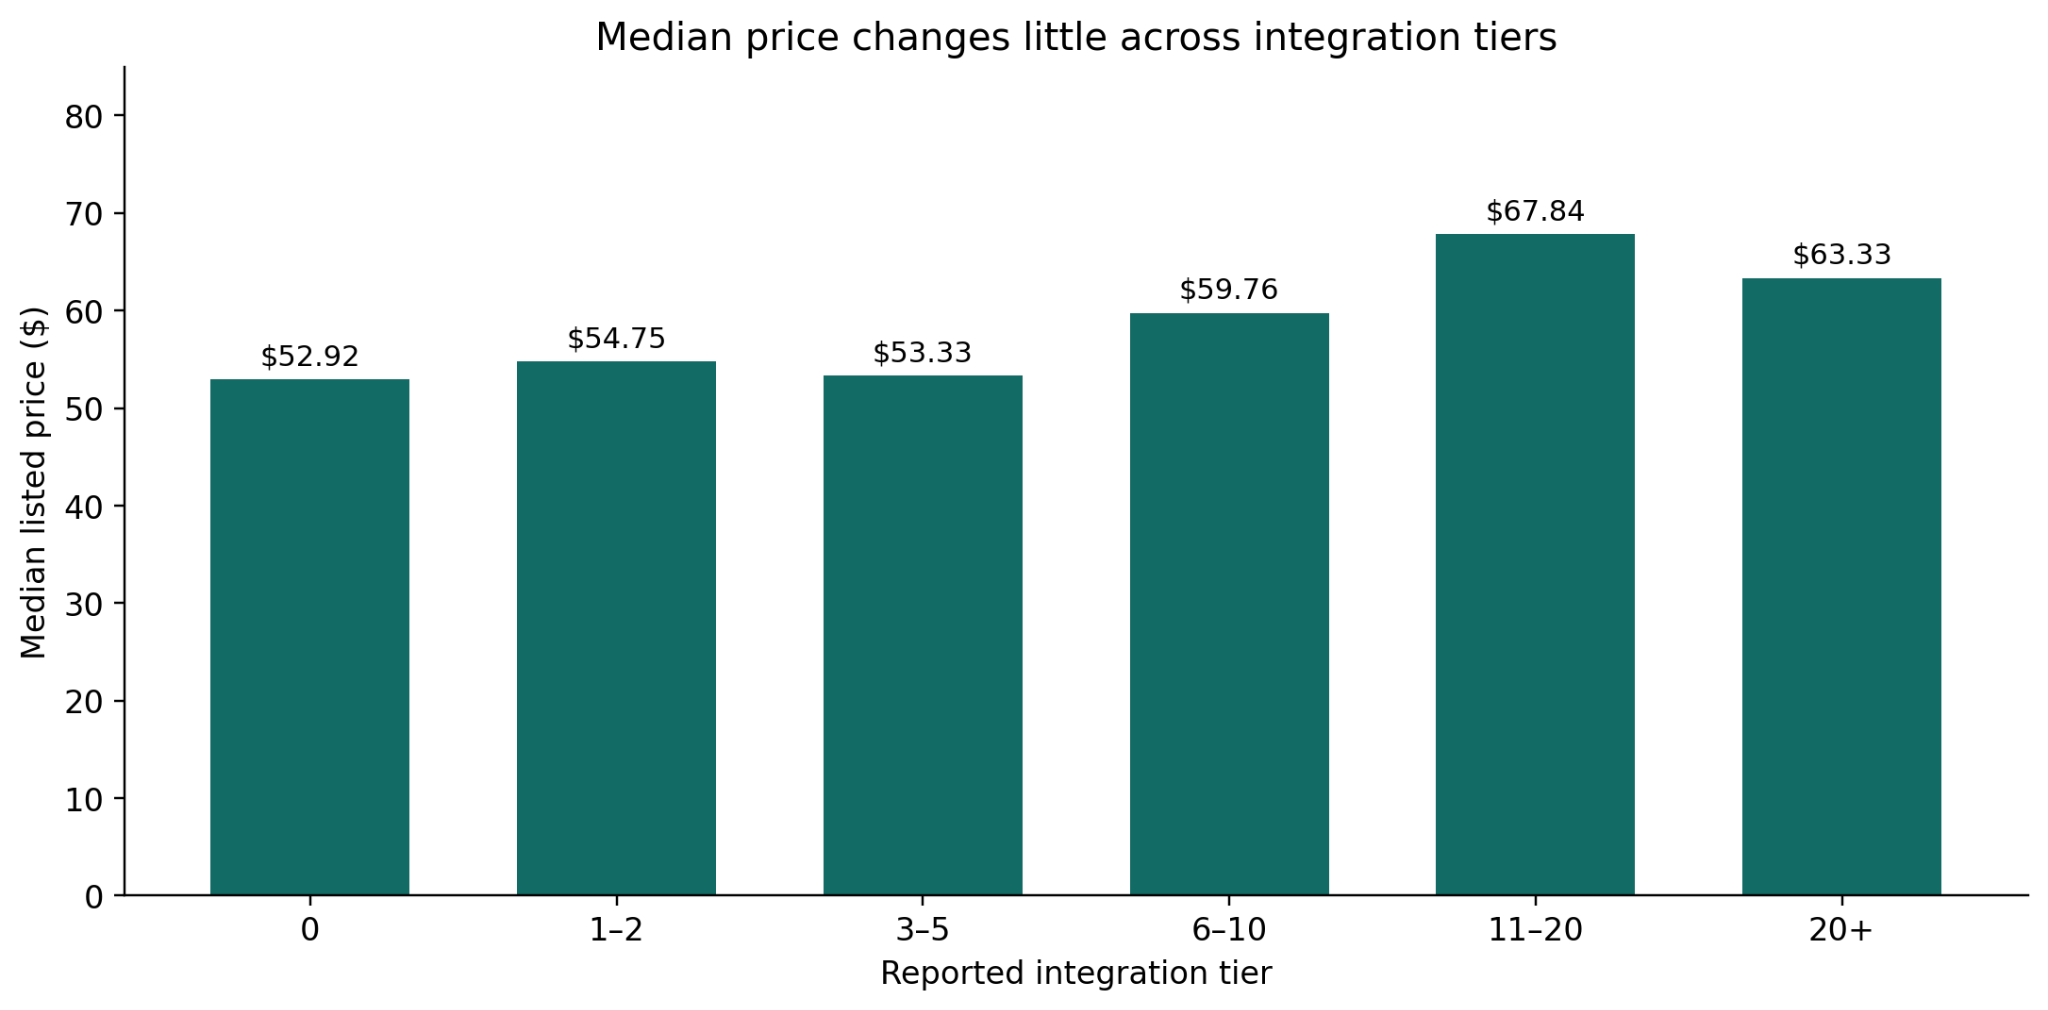
Average prices vary much more widely, from $171.79 to $386.56 across these tiers, consistent with the source's observation that unusually high prices can affect means. However, the report does not provide price distributions or a complete outlier audit, so the exact contribution of individual listings cannot be verified. The reported r = −0.06 is a correlation across 122 categories, between average category integrations and average category price. It is not a product-level correlation and does not prove that adding an integration has no pricing value for a particular product.
The source does not explicitly define the currency period, billing cadence or price normalization method. For that reason, the dollar figures should be described as reported listed prices, not automatically as verified monthly subscription fees.
Which SaaS categories have the most integrations?
Integration breadth varies strongly by category. Among 122 categories with at least 50 products each, the report's highest average is Lead Generation at 21.2 integrations per product, followed by Affiliate (16.0) and Customer Engagement (14.2).
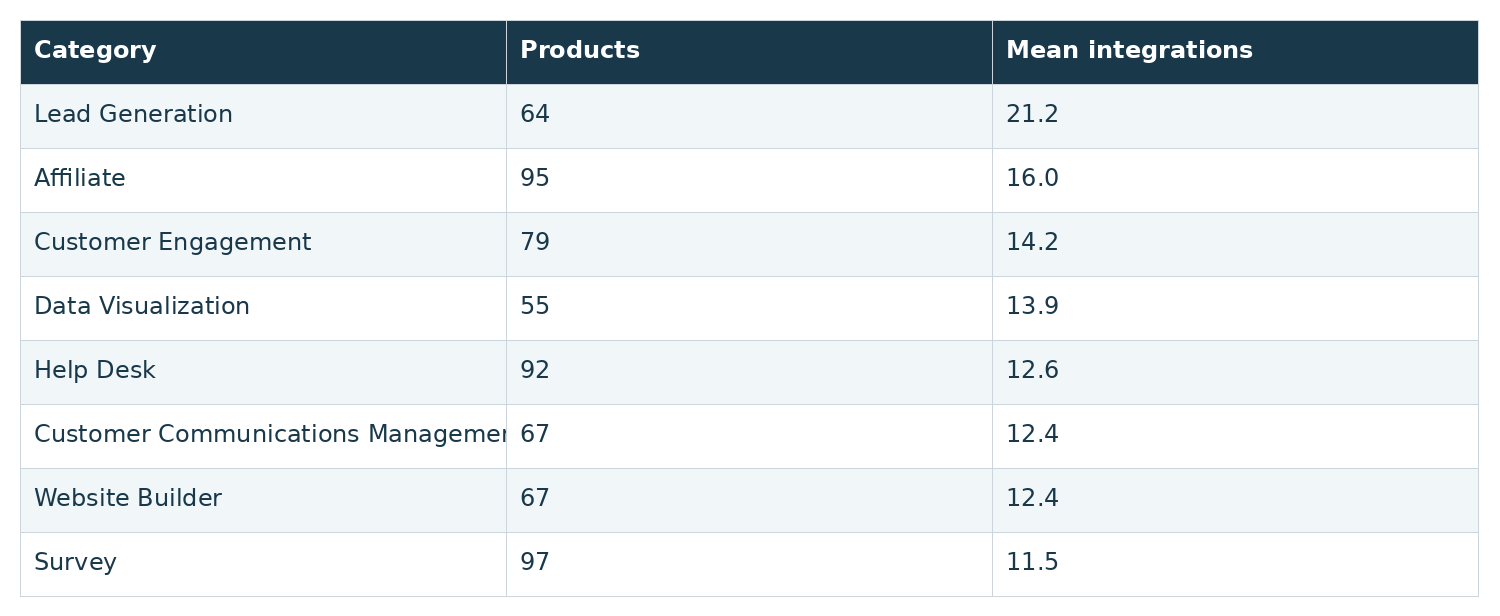
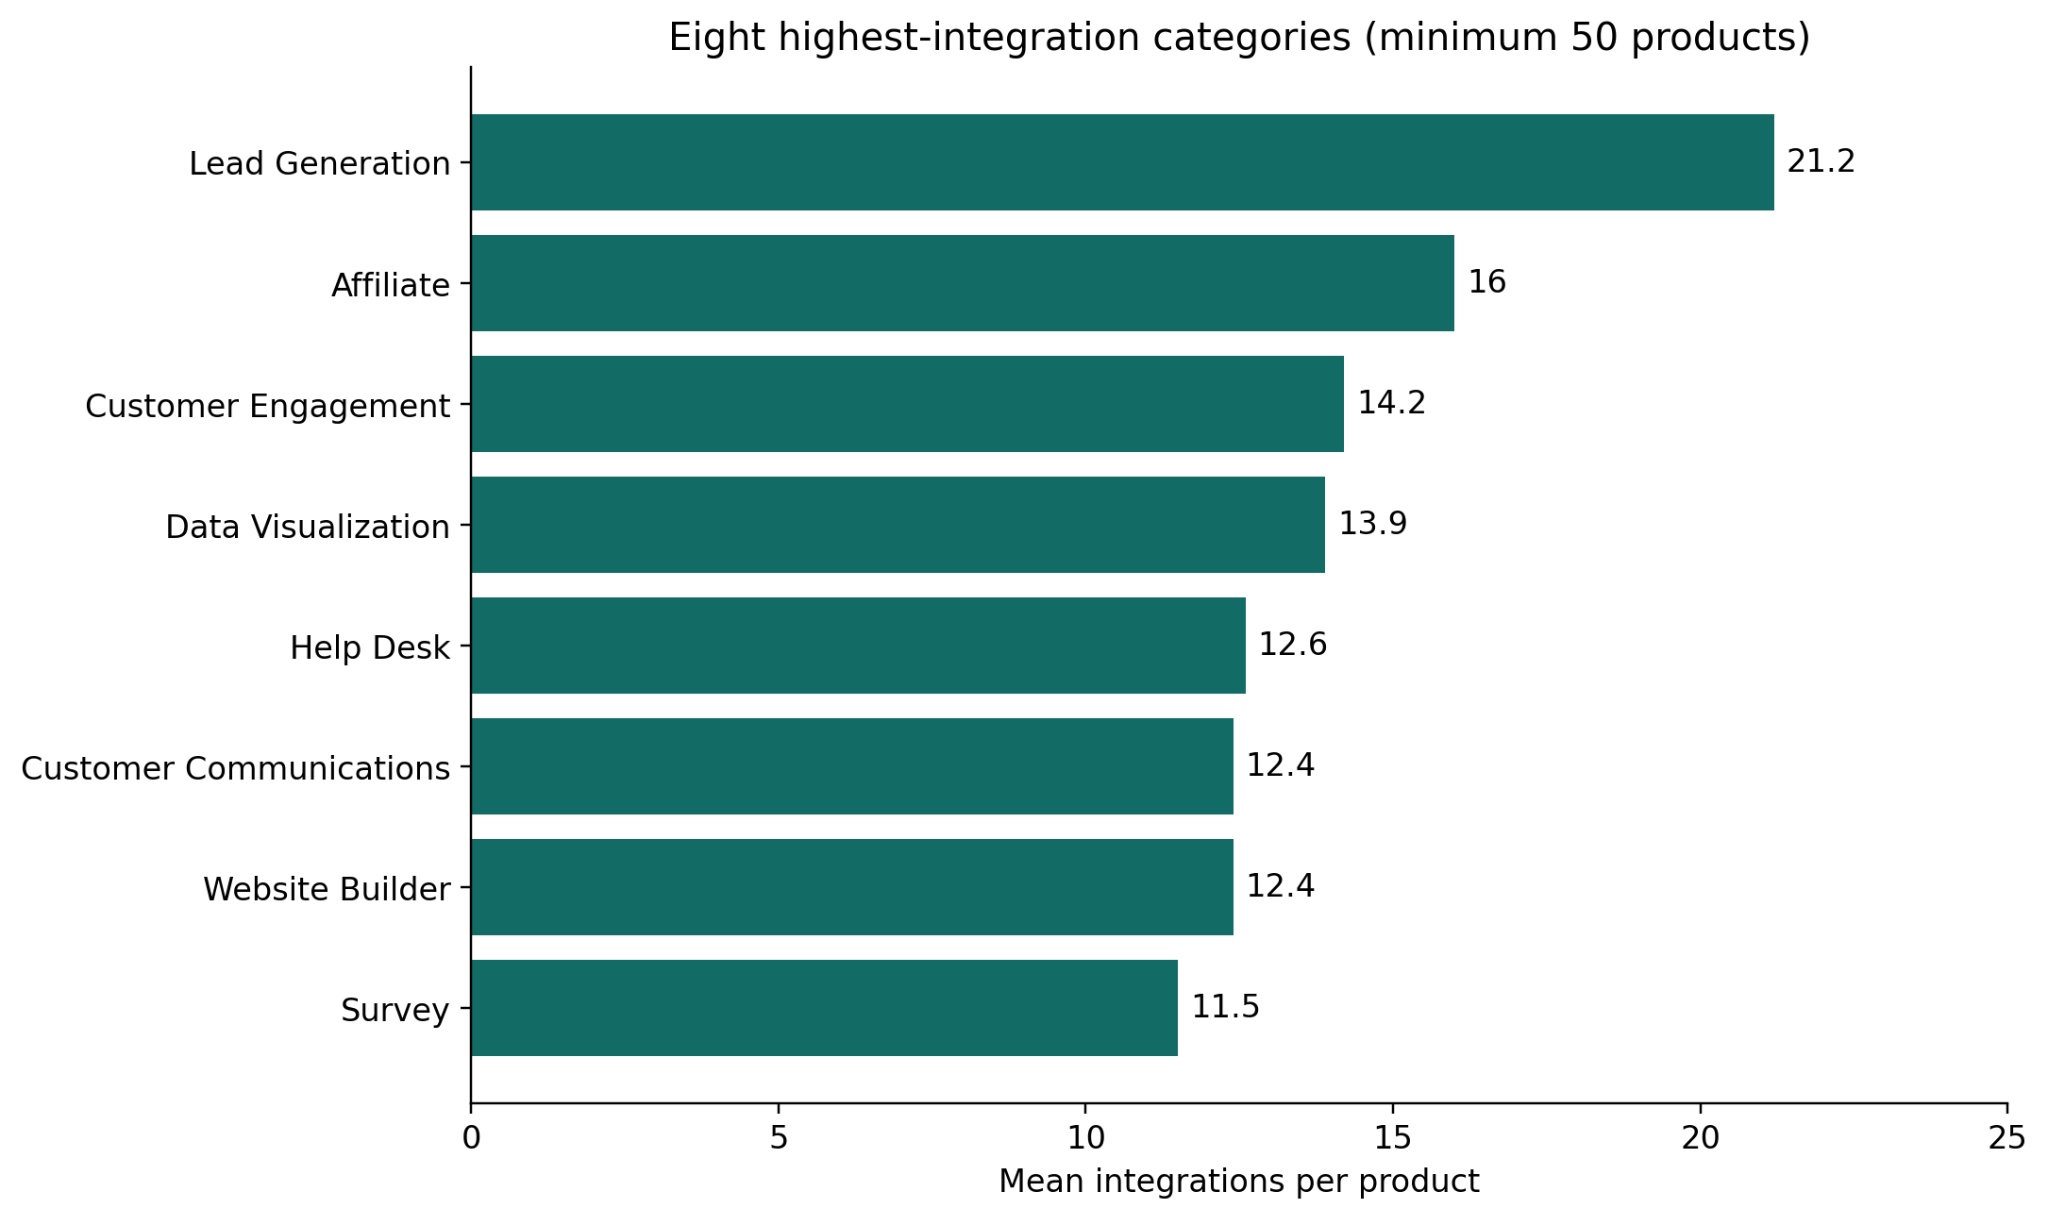
These categories often participate in multi-tool workflows: lead capture, customer engagement, analytics and support may depend on exchanging data with CRM, marketing, communications or reporting systems. That offers a plausible reason for their higher counts, but the report does not directly test the business value of those connections. The category medians are also much lower than their means. Lead Generation's mean is 21.2, but its median is five; Affiliate's mean is 16.0, but its median is two. Even in categories with relatively large integration averages, the typical catalog product may connect to only a few systems.
Which SaaS categories are the leanest?
At the other end of the ranking, Telemedicine averages 0.4 integrations, followed by Hospital Management at 0.9. Farm Management and Home Health Care each average 1.1; four additional categories average 1.3.
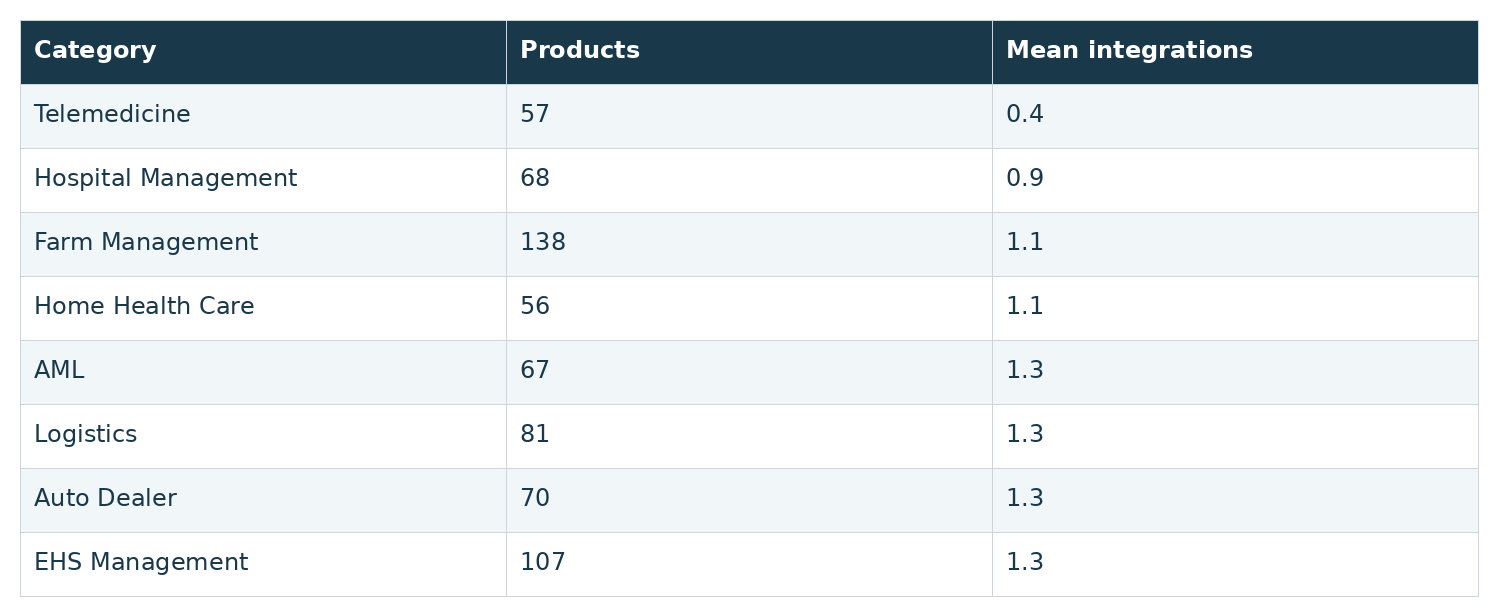
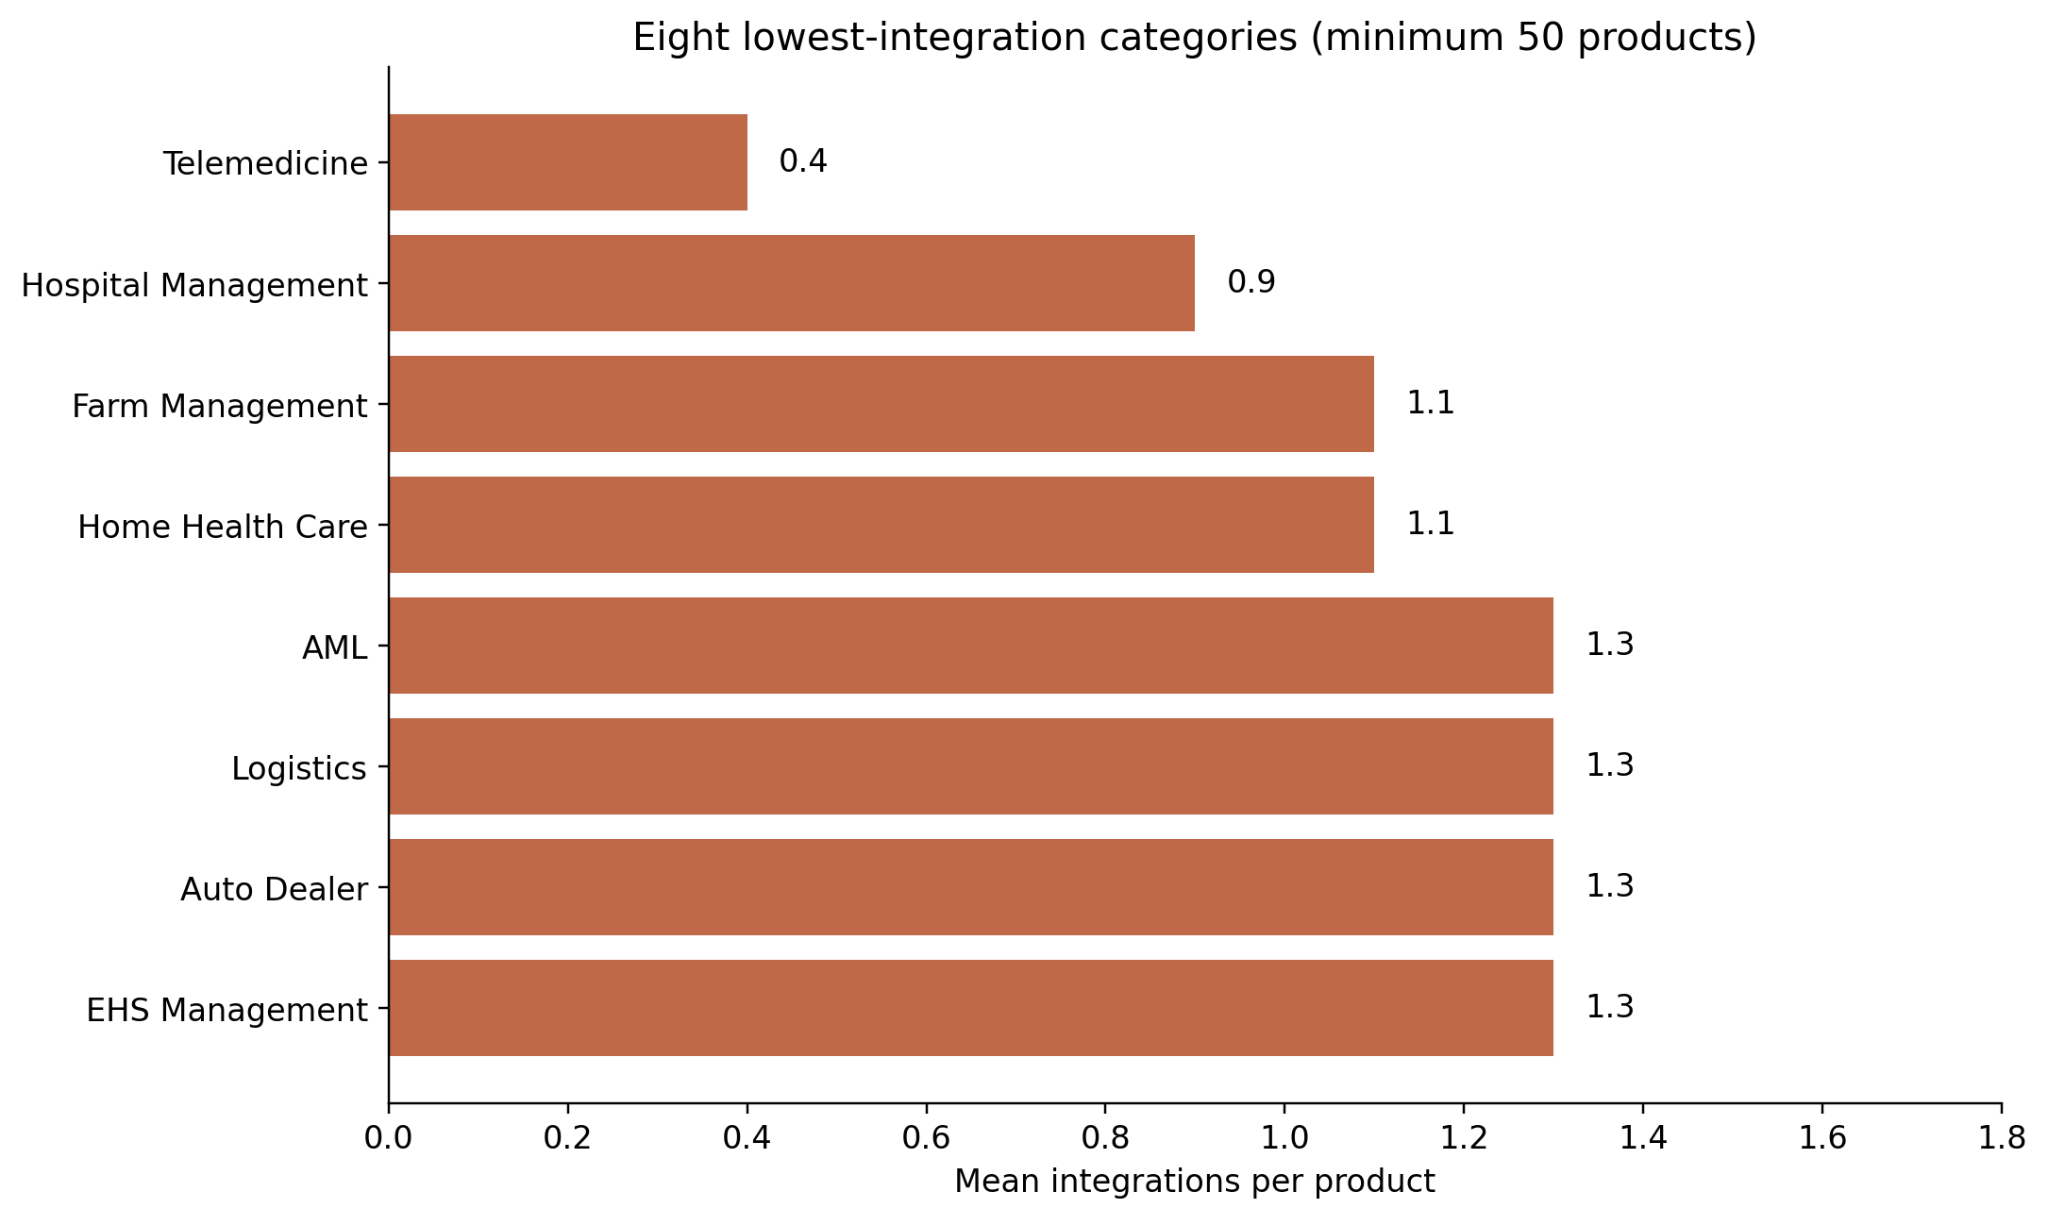
The report interprets this group as specialized, operational or regulated software. That is a reasonable editorial hypothesis: some products are designed around focused workflows rather than extensive third-party ecosystems. But a low integration count is not evidence of low capability, and it should not be taken as proof that regulation prevents integrations. The source contains no direct comparison of security, compliance requirements or product functionality. The report's $0.03 average price for Hospital Management is an unusual entry that deserves a source-data check before anyone interprets it as a typical commercial price. The underlying pricing records were not provided, so it cannot be reconciled here.
Does having more integrations improve SaaS survival?
The report finds nearly identical Active-status shares across its integration tiers. The lowest displayed share is 98.92%, while the highest is 99.15%, a spread of 0.23 percentage points.
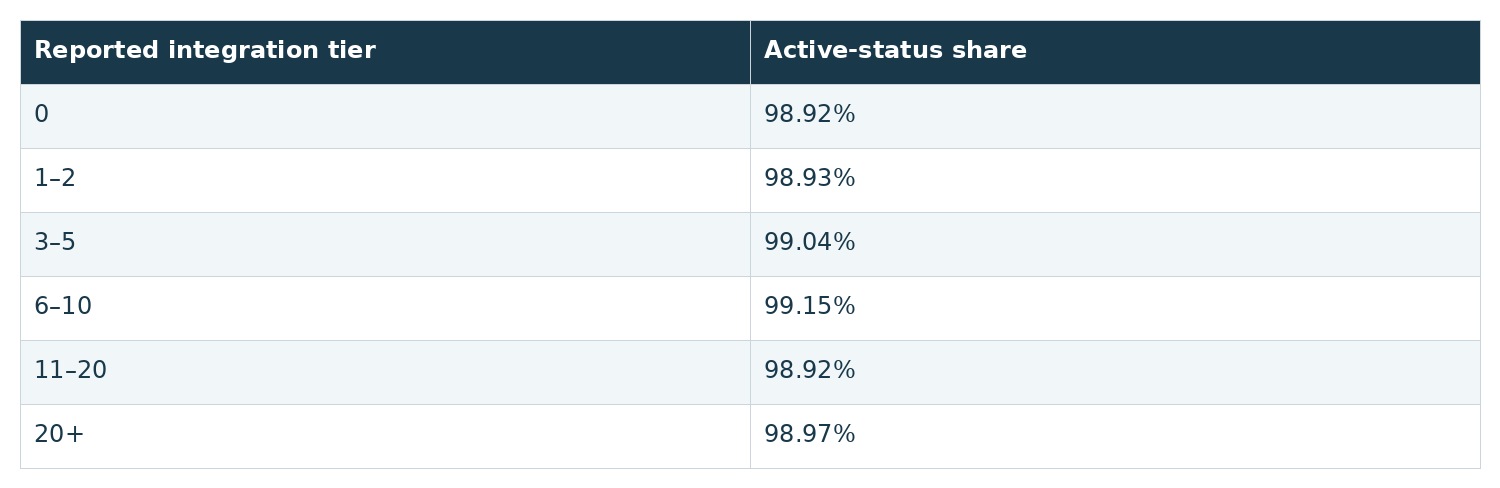
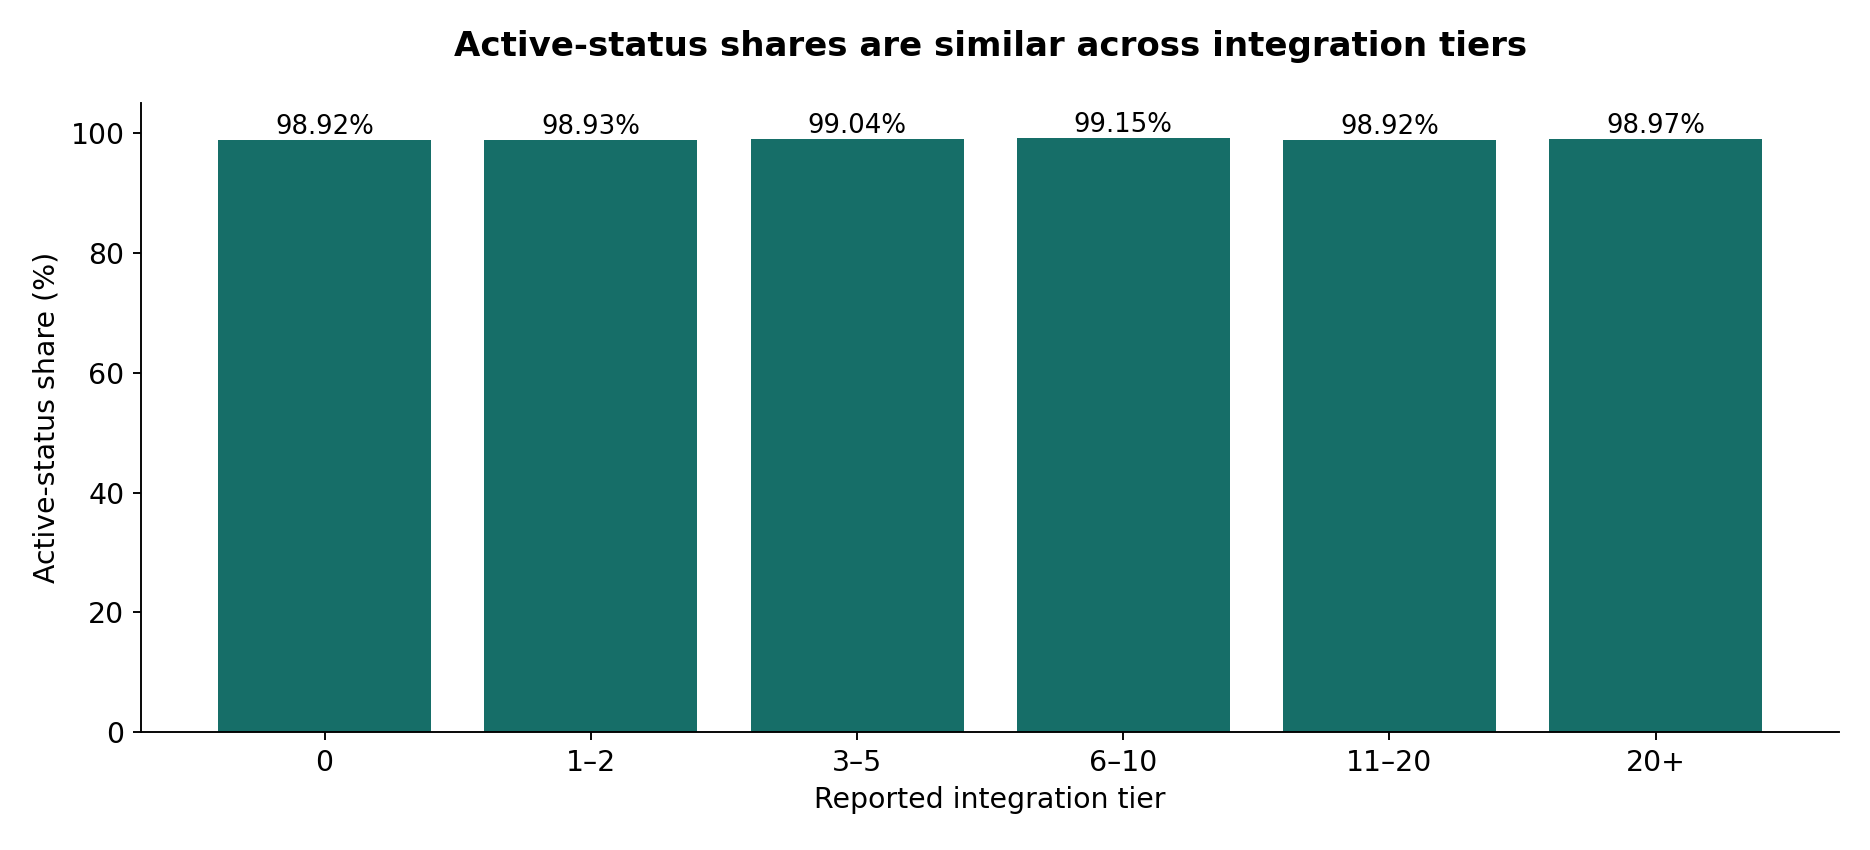
The term “survival” in the source should be interpreted cautiously. A current Active label does not measure how long a product has operated, whether it has ever changed ownership, or its future likelihood of closure. The report does not show time-to-event analysis, follow-up periods or adjustments for product age. Consequently, the data supports little observed difference in Active-status share across tiers, not the stronger claim that integrations have no effect on long-term survival.
What should SaaS founders and product teams take away?
The findings suggest that integration roadmaps should be aligned with product workflow and customer needs, not an assumed universal target for connector counts. A lead-generation product may depend heavily on data flowing between applications; a narrowly focused healthcare or operations tool may have different priorities. The pricing tables also discourage a simplistic equation between more integrations and higher prices. Typical listed prices remain in a relatively narrow band across integration tiers, and newer launch cohorts show nearly identical median prices despite markedly different average integration counts.
Those are useful descriptive observations, but they do not replace customer research, willingness-to-pay testing or an assessment of the cost of maintaining each connector. For buyers, a product's integration count is only one dimension of interoperability. The reliability, depth, documentation, security and maintenance of the specific integrations a business needs can matter more than the total displayed number. None of those qualities is measured in this report.
Methodology and limitations
Source: Solevant, Integration Counts in SaaS by Launch Year and Price. The source summarizes 122 categories, but the underlying product-level records are unavailable. The extraction date is not stated. Feature definition: “Features” means integration count only. The analysis does not measure all product features or functionality. Launch years: The source reports annual cohorts from 2005 to 2025. Newer cohorts are underrepresented, especially 2023 (466 products), 2024 (110) and 2025 (27). The 2020–2025 and 2010–2015 comparisons are cross-sectional groups of products, not repeated measurements of the same vendors.
Pricing: The source gives reported price summaries but does not fully document currency normalization, billing periods, missing-price treatment or outlier rules. Its category-level correlation of −0.06 is not a product-level estimate. Integration-tier boundaries: The source labels adjacent tiers “11–20” and “20+”, which overlap at 20 as written. The original assignment rule is not available; the charts reproduce the source labels without claiming a corrected boundary. Active status: The 98.92%–99.15% values are cross-sectional Active-status shares, not annual survival rates. No causal relationship between integration count, price or product longevity can be established from these tables.
Category scope: The report summarizes 122 categories with at least 50 products, showing only the eight highest and eight lowest in the report. Category overlap and full-record coverage are not independently documented.
Frequently asked questions
Are newer SaaS products launching with fewer integrations?
In this catalog, yes. Products launched in 2020–2025 average 4.2 integrations, compared with 7.81 for 2010–2015 launches. The report cautions that the newest years have small, still-developing samples.
When did SaaS integration counts peak?
The report identifies 2010–2013 as the highest of five size-weighted launch eras, averaging 8.87 integrations per product. The individual 2011 cohort has a reported mean of 13.3.
Do more SaaS integrations mean a higher subscription price?
Not consistently in these tables. Median listed prices range from $52.92 to $67.84 across integration tiers, and the correlation between category-average integration count and category-average price is −0.06.
Which SaaS category has the most integrations?
Lead Generation, averaging 21.2 integrations among 64 products in the source's category table.
Which category has the fewest integrations?
Telemedicine, averaging 0.4 integrations among 57 products.
Does a higher integration count improve SaaS survival?
The report does not establish that. Active-status shares range from 98.92% to 99.15% across the six integration tiers, but those shares do not measure longitudinal survival.
Does this report count every feature a SaaS product offers?
No. It counts integrations with other tools and platforms. A product with many built-in capabilities and zero external integrations would still be classified as lean by this measure.
Conclusion
Solevant's 2005–2025 analysis shows fewer recorded integrations among newer SaaS launch cohorts, similar median prices across the two comparison cohorts, and large differences in integration breadth between software categories. Its strongest lesson is not that integrations are unnecessary, but that integration count alone is a weak substitute for understanding a product's purpose, pricing and maturity. Because the dataset is cross-sectional, the newest cohorts are small and the term “features” covers integrations only, these findings should guide further investigation rather than be presented as proof of a permanent industry shift.
Source: Solevant, Integration Counts in SaaS by Launch Year and Price (Features Variation). Catalog extraction date not supplied.