

Exchange Index: African Markets vs North America — 594 Tracked Exchanges Compared
Solevant's Exchange Index briefing reports 574 tracked exchanges and 1,021 associated entity rows for the United States and Canada, compared with 20 tracked exchanges and 37 entity rows for South Africa, Nigeria and Ghana. Across the two selected groups, that is 594 tracked exchanges and 1,058 entity records. The status fields also differ. All 37 African-group entity records are marked Active, while the North American group contains 834 Active, 185 Expired and two Updated records. These differences describe the contents and labels of an index, not the number of trading venues operating throughout either continent, the value traded on them or a historical rate of exchange closures.
The briefing argues that North American markets have more specialized electronic venues while the selected African markets rely on prominent national institutions. That is a useful hypothesis to investigate, but directory counts alone cannot establish market structure, resilience or trading liquidity. The most defensible findings are the counts, status distribution and named venue-code concentrations actually published in the source.
Key findings at a glance
- 574 tracked exchanges appear in the US–Canada group, compared with 20 in South Africa, Nigeria and Ghana: a 28.7-to-one ratio within the index.
- The corresponding entity-row totals are 1,021 and 37, a 27.6-to-one ratio. Exchange identifiers and entity rows are different units and must not be interchanged.
- The African-group sample has 37 of 37 records marked Active (100%). That does not prove that all exchanges across Africa are currently operating or have never closed.
- The US–Canada sample has 834 Active records (about 81.7%), 185 Expired (18.1%) and two Updated (0.2%). Expired is a database status, not a verified failure or acquisition event.
- The report associates 17 of the 37 African-group entity entries (45.9%) with the Johannesburg Stock Exchange's XJSE identifier. Those are entries, not 17 distinct JSE exchanges.
- Among the published North American venue identifiers, XNAS has 39 entries, XCBO 32 and XNYS 26; the seven displayed groups sum to 174 entries.
- Entity rows per tracked exchange are 1.78 in the US–Canada group and 1.85 in the African group. These similar ratios caution against treating the total-count gap alone as proof of a different degree of fragmentation.
How many exchanges does the index track in the five countries?
The briefing's headline comparison is 574 tracked exchanges for the United States and Canada versus 20 for South Africa, Nigeria and Ghana. The larger group has 28.7 times as many tracked exchange identifiers as the smaller one.
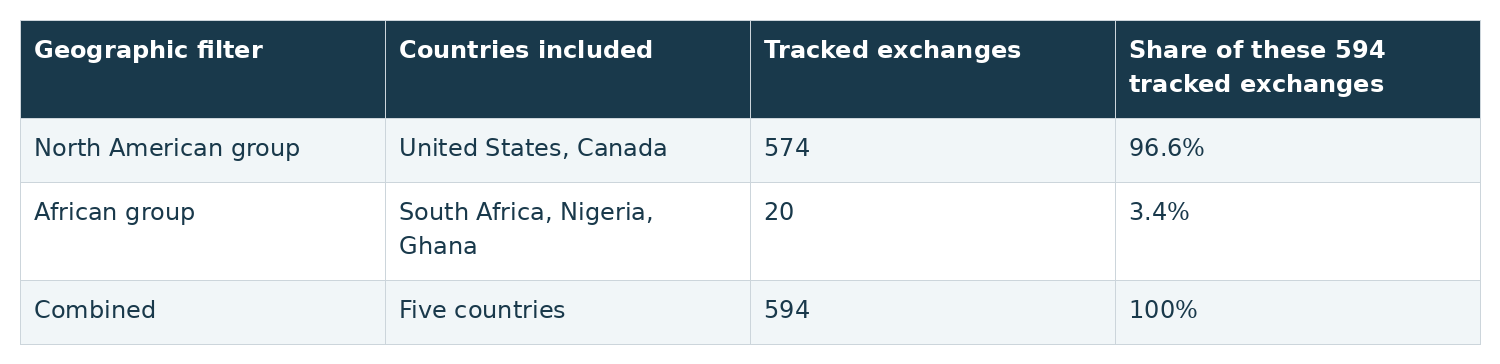
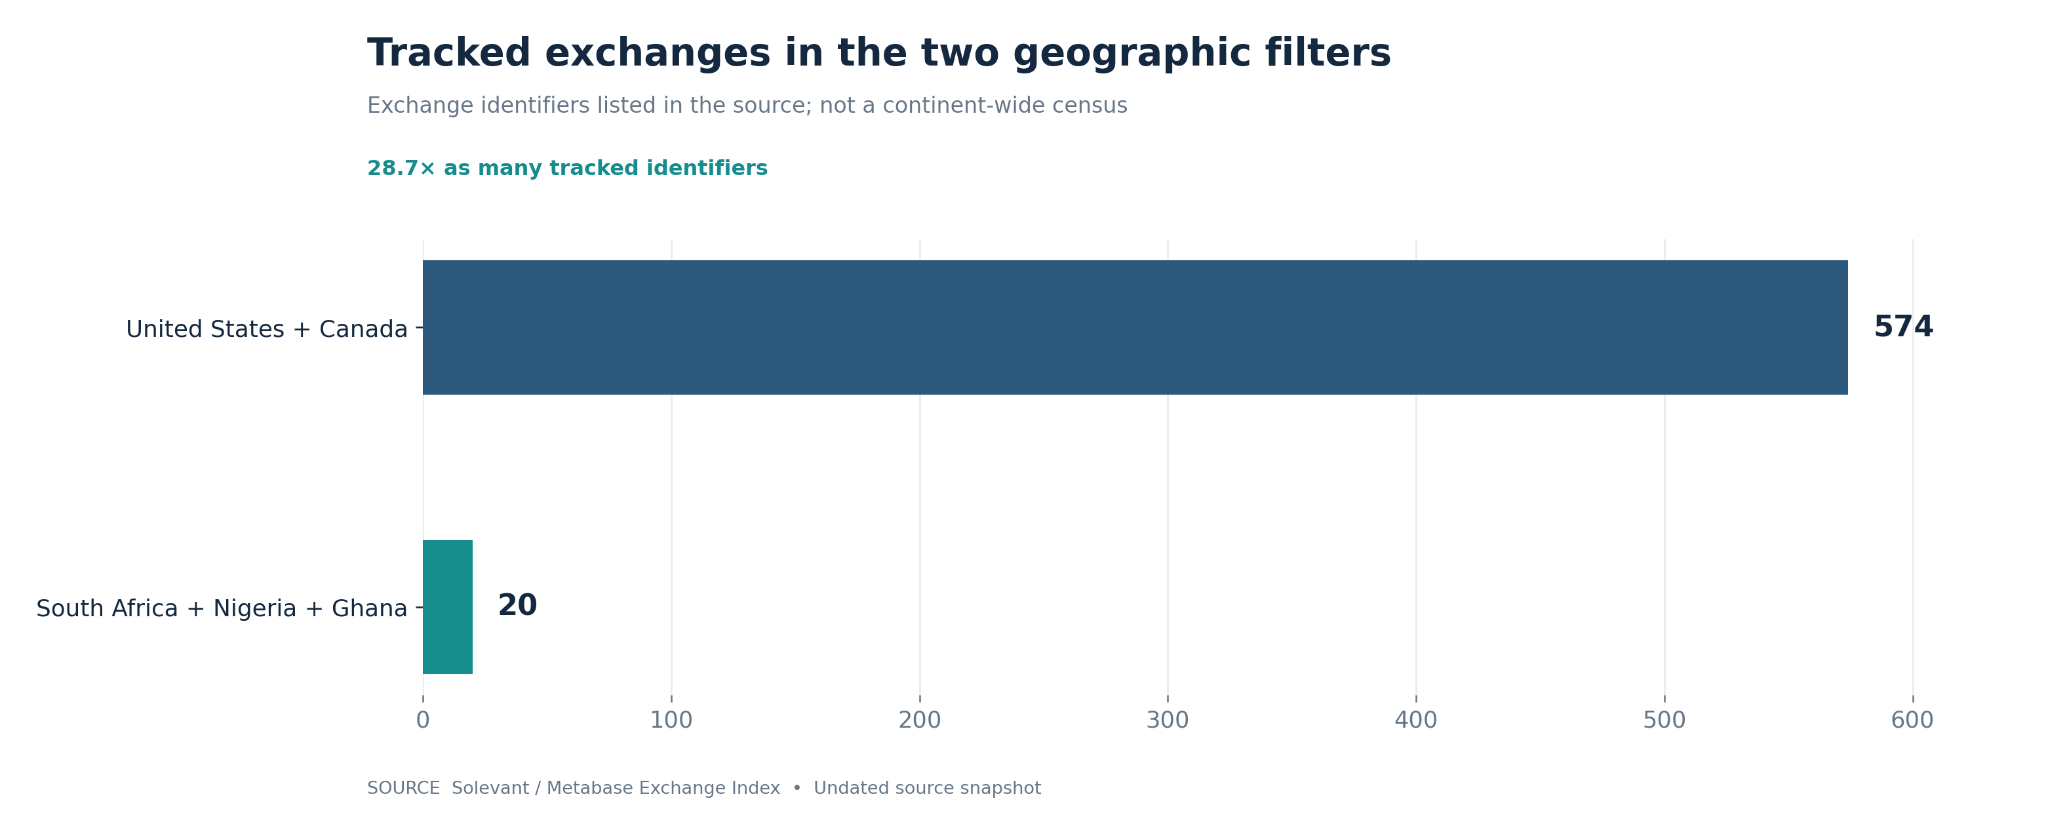
This is not an Africa-wide versus North America-wide census. The African filter includes only three countries; the North American filter includes two and excludes Mexico and other territories. The report does not give individual country totals or a definition of what qualifies as one tracked exchange. Nor does it show how many identifiers are conventional stock exchanges versus alternative trading systems, market segments or related infrastructure. As a result, the 28.7-to-one ratio measures catalog representation for these selected filters. It cannot be converted into a comparison of national economic development, investment access, capital raised or market trading volumes.
What is the difference between tracked exchanges and entity rows?
The report separately counts entity rows: 1,021 in the US–Canada filter and 37 in the three-country African filter. Together, the two groups contain 1,058 rows, of which about 96.5% belong to the North American group.

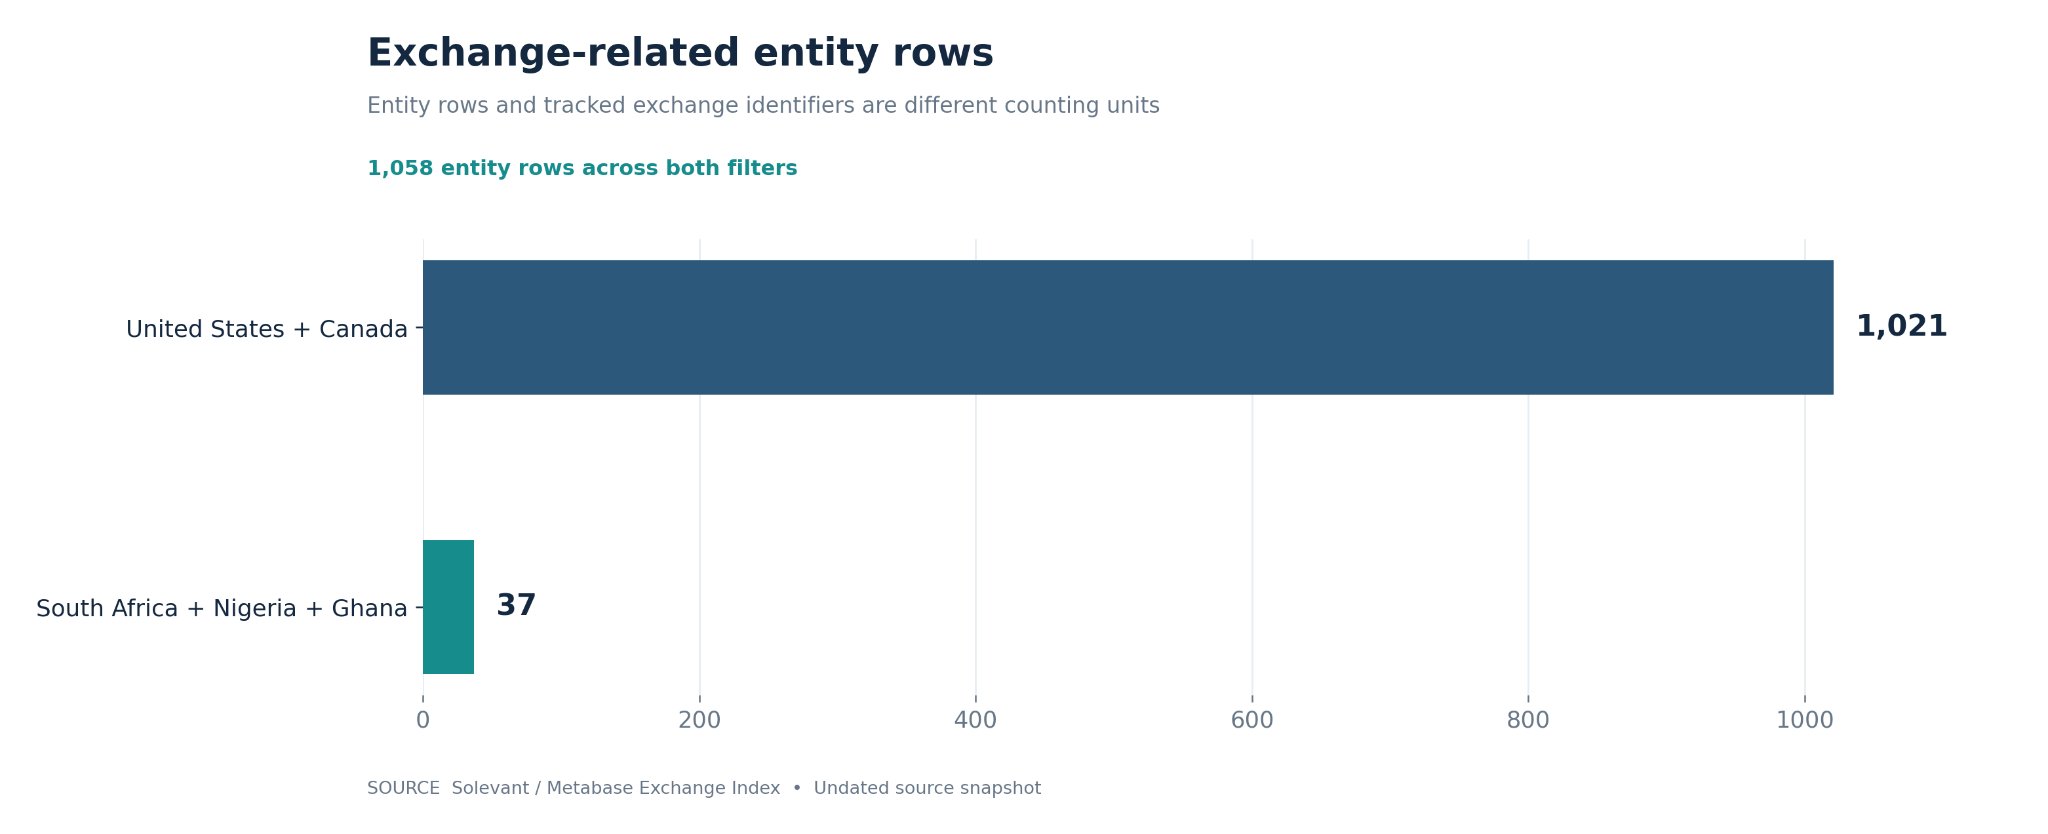
The source presents the greater number of North American entries as evidence of a broad ecosystem of electronic communication networks (ECNs), alternative trading systems (ATSs) and specialized trading desks. Its named-code examples support the existence of multiple types of indexed venues, but the aggregate totals alone do not identify how many records belong to each type. Similarly, the smaller African count is consistent with an index centered on established exchange institutions, but it does not independently demonstrate that all African markets are centralized or that no additional trading facilities exist outside the catalog.
Are more exchange records marked Active in the African sample?
Yes, within the source's recorded status fields. All 37 entity rows in the African filter are labeled Active. The US–Canada filter contains 834 Active, 185 Expired and two Updated rows, totaling 1,021.
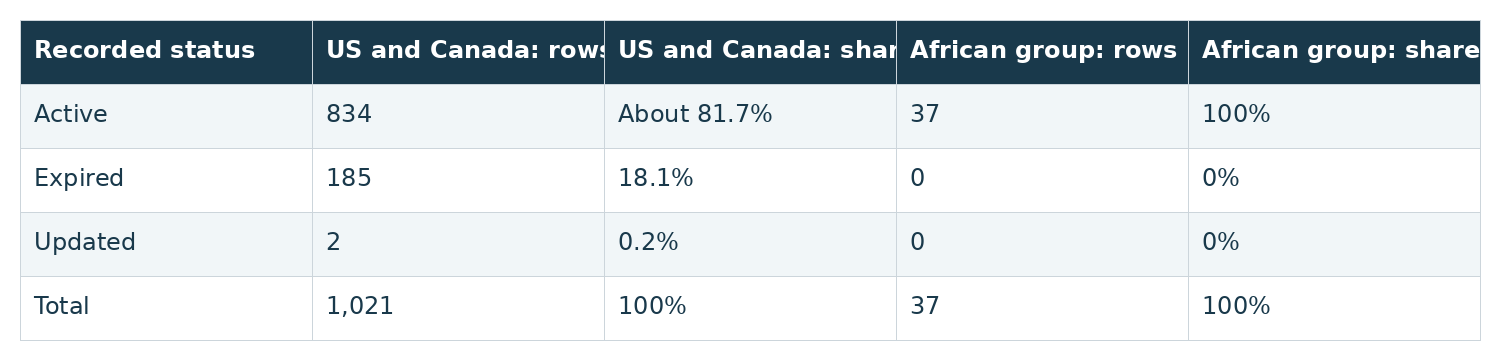
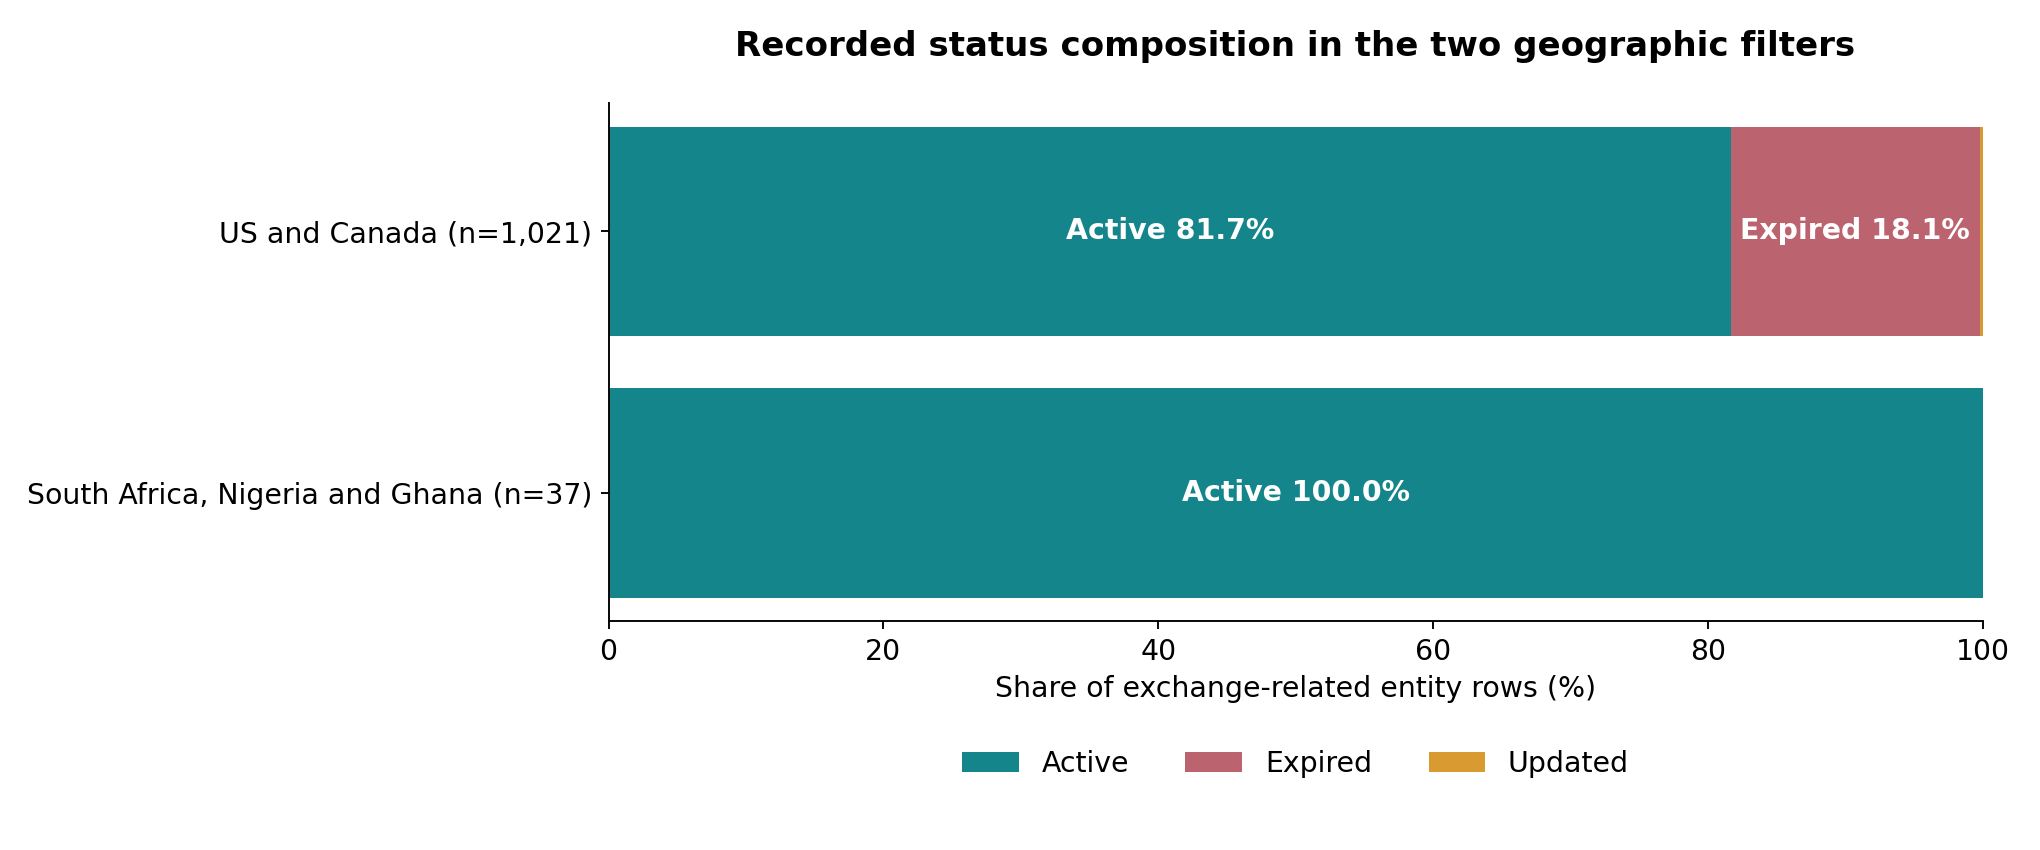
The source prints the North American Active percentage as 81.69%; dividing its stated count of 834 by 1,021 gives approximately 81.68%. The article and chart use about 81.7% to avoid implying greater precision than the rounded source figures support. Crucially, 100% Active in a snapshot is not an exchange-survival rate. The source does not disclose when statuses were verified, whether expired or defunct African entities were eligible for inclusion, or how missing and historic records were handled. Likewise, 18.1% Expired is the share of records currently bearing that label, not an annual rate of market failure or consolidation.
The briefing speculates that North American expired entries reflect acquisitions, venue retirements and technology changes. Those mechanisms may be plausible, but no event-level history is supplied to show why any of the 185 records is marked Expired. The two Updated records cannot be interpreted as regulatory relicensing without a documented definition of that status.
What does the index show about the Johannesburg Stock Exchange?
The report associates 17 of the 37 African-group market entries with the Johannesburg Stock Exchange (JSE), identified as XJSE. That is 45.9% of the selected African group's entity rows. The remaining 20 entries (54.1%) represent other listed identifiers and market entities in the three-country filter.
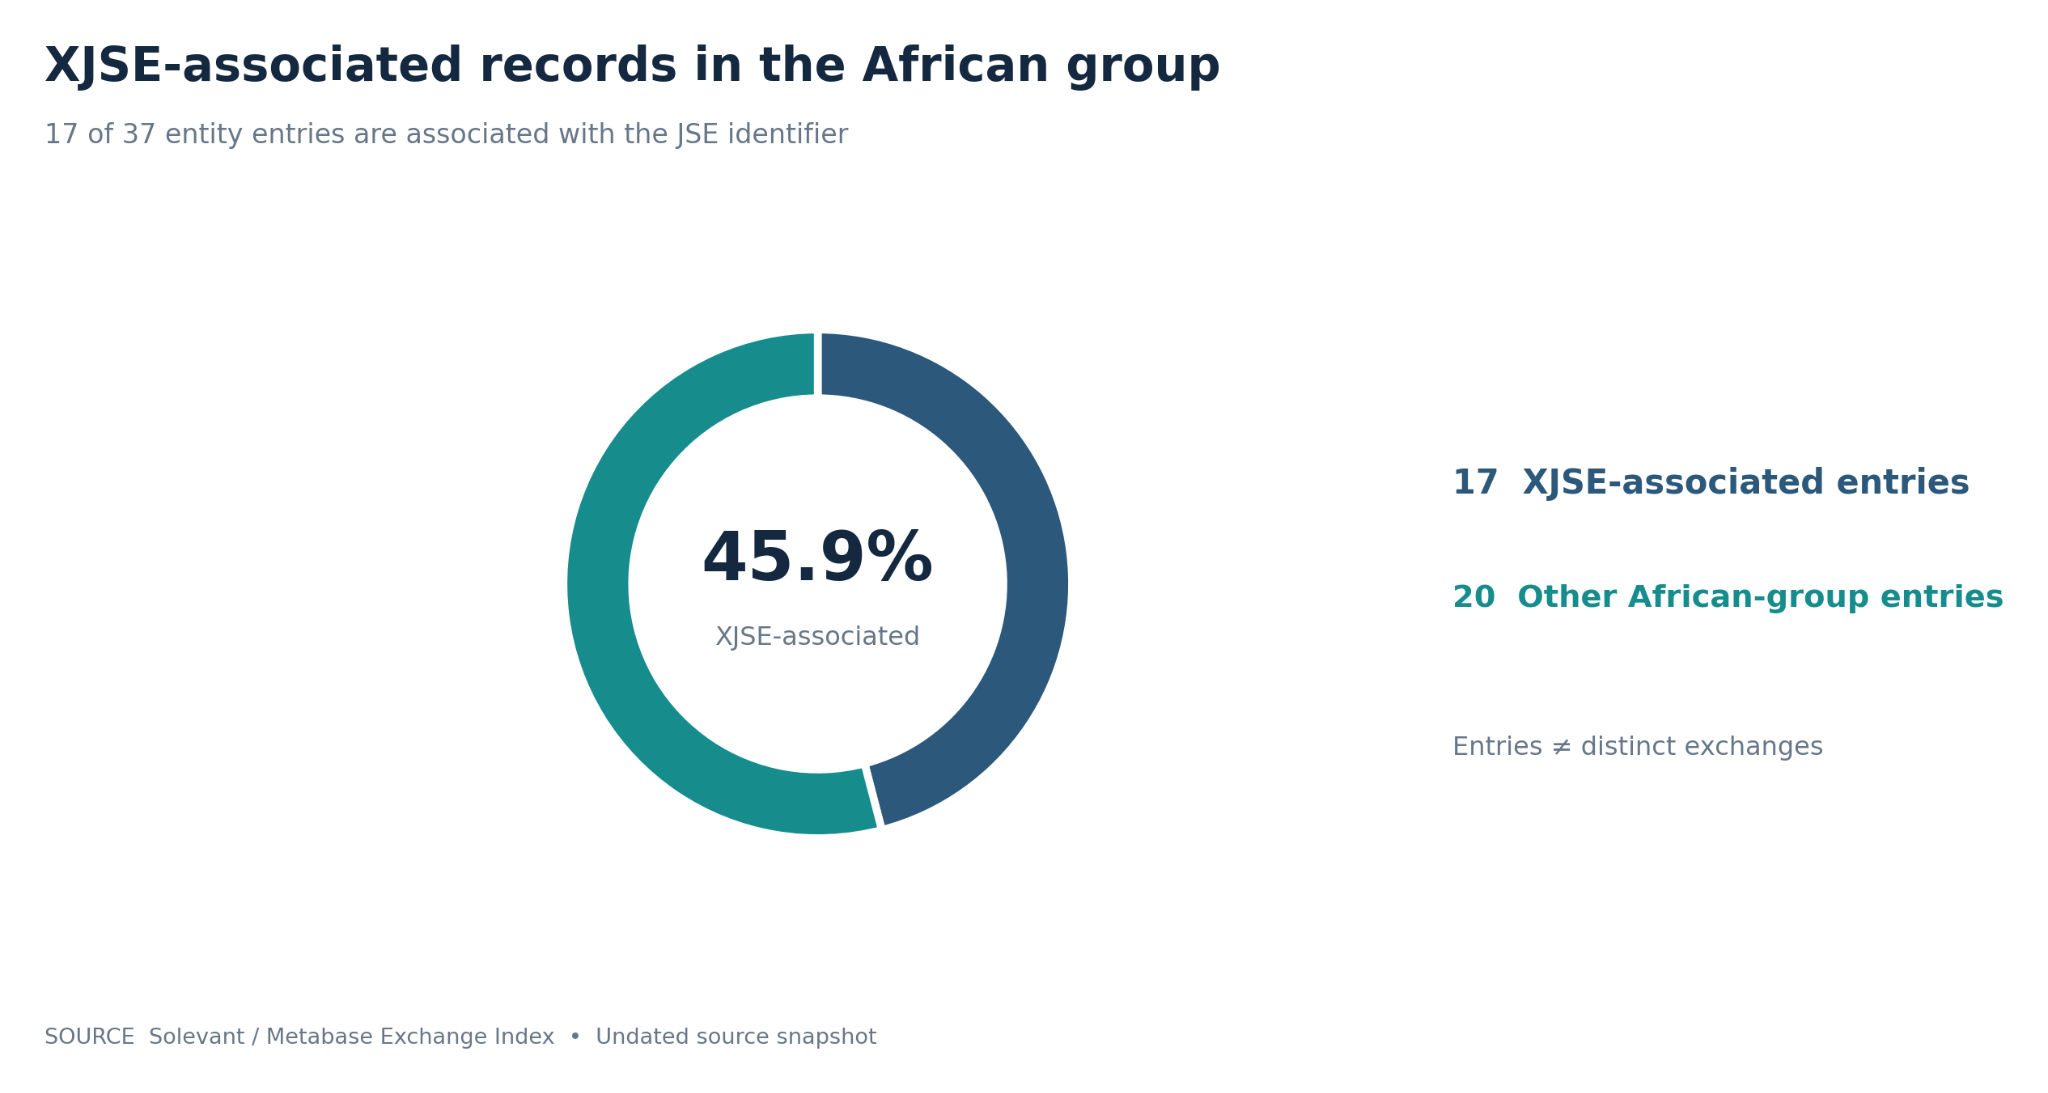
The briefing names several JSE-related segments, including the Cash Bond Market, Repo Market, Currency Derivatives, SAFEX Equity Derivatives and AltX. It also names other South African venues or identifiers, such as A2X Markets, ZAR X and Cape Town Stock Exchange, alongside West African institutions including the Nigerian Exchange Group, NASD OTC Market and Ghana Stock Exchange. Those names describe what the report says is represented in the index. The document does not provide a record-level export, full MIC mapping or a dated operational verification for each named venue. It therefore cannot establish that every named segment remains active today or that all 17 JSE-associated rows are separate, concurrently operating markets.
The strongest supported observation is concentration of indexed entries around a recognizable exchange identifier. It is not evidence that the JSE processes a particular volume of bonds, equities or derivatives relative to other venues.
Which North American venue codes have the most entries?
The source lists seven prominent North American identifiers. Nasdaq (XNAS) leads the displayed examples with 39 entity entries, followed by Cboe (XCBO) with 32 and NYSE (XNYS) with 26.
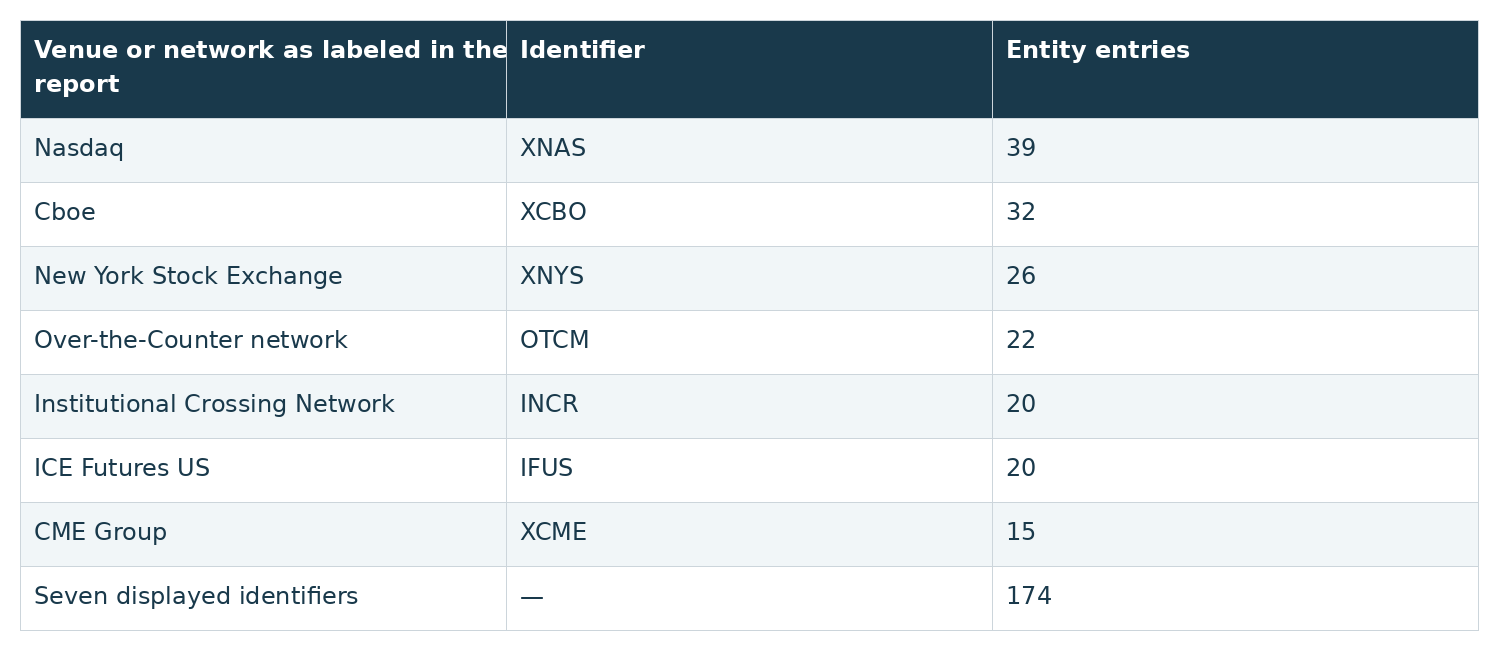
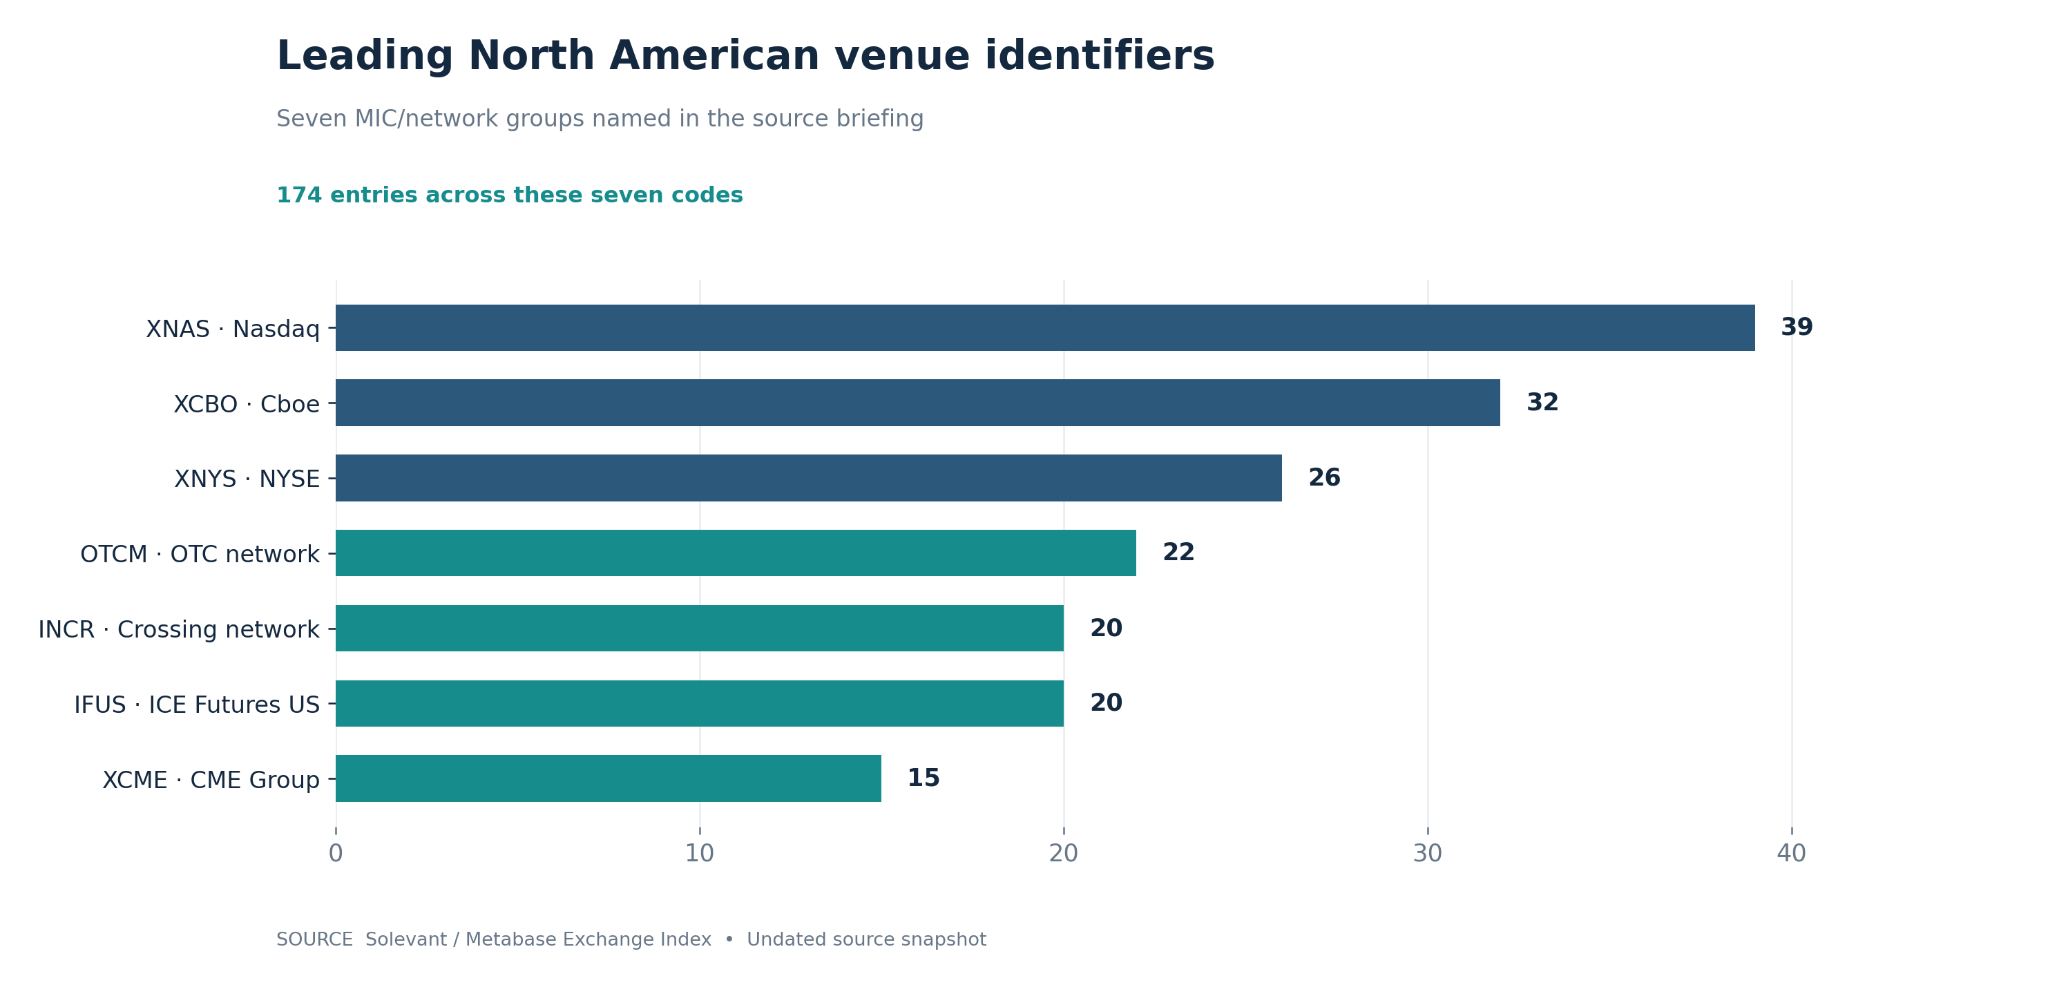
The seven displayed counts add up to 174, approximately 17.0% of the 1,021 North American entity rows if each row belongs to one displayed identifier. The briefing does not supply the complete ranking or enough information to validate every code-to-organization mapping independently. The presence of OTC, crossing-network, futures and major exchange labels suggests that the index groups together different kinds of trading infrastructure. That makes its scope interesting for research, but also makes it especially important not to describe all 574 tracked exchanges as equivalent to conventional national stock exchanges.
Do the record totals prove North America is more fragmented?
Not on their own. A simple check is to divide entity rows by tracked exchanges in each regional filter.

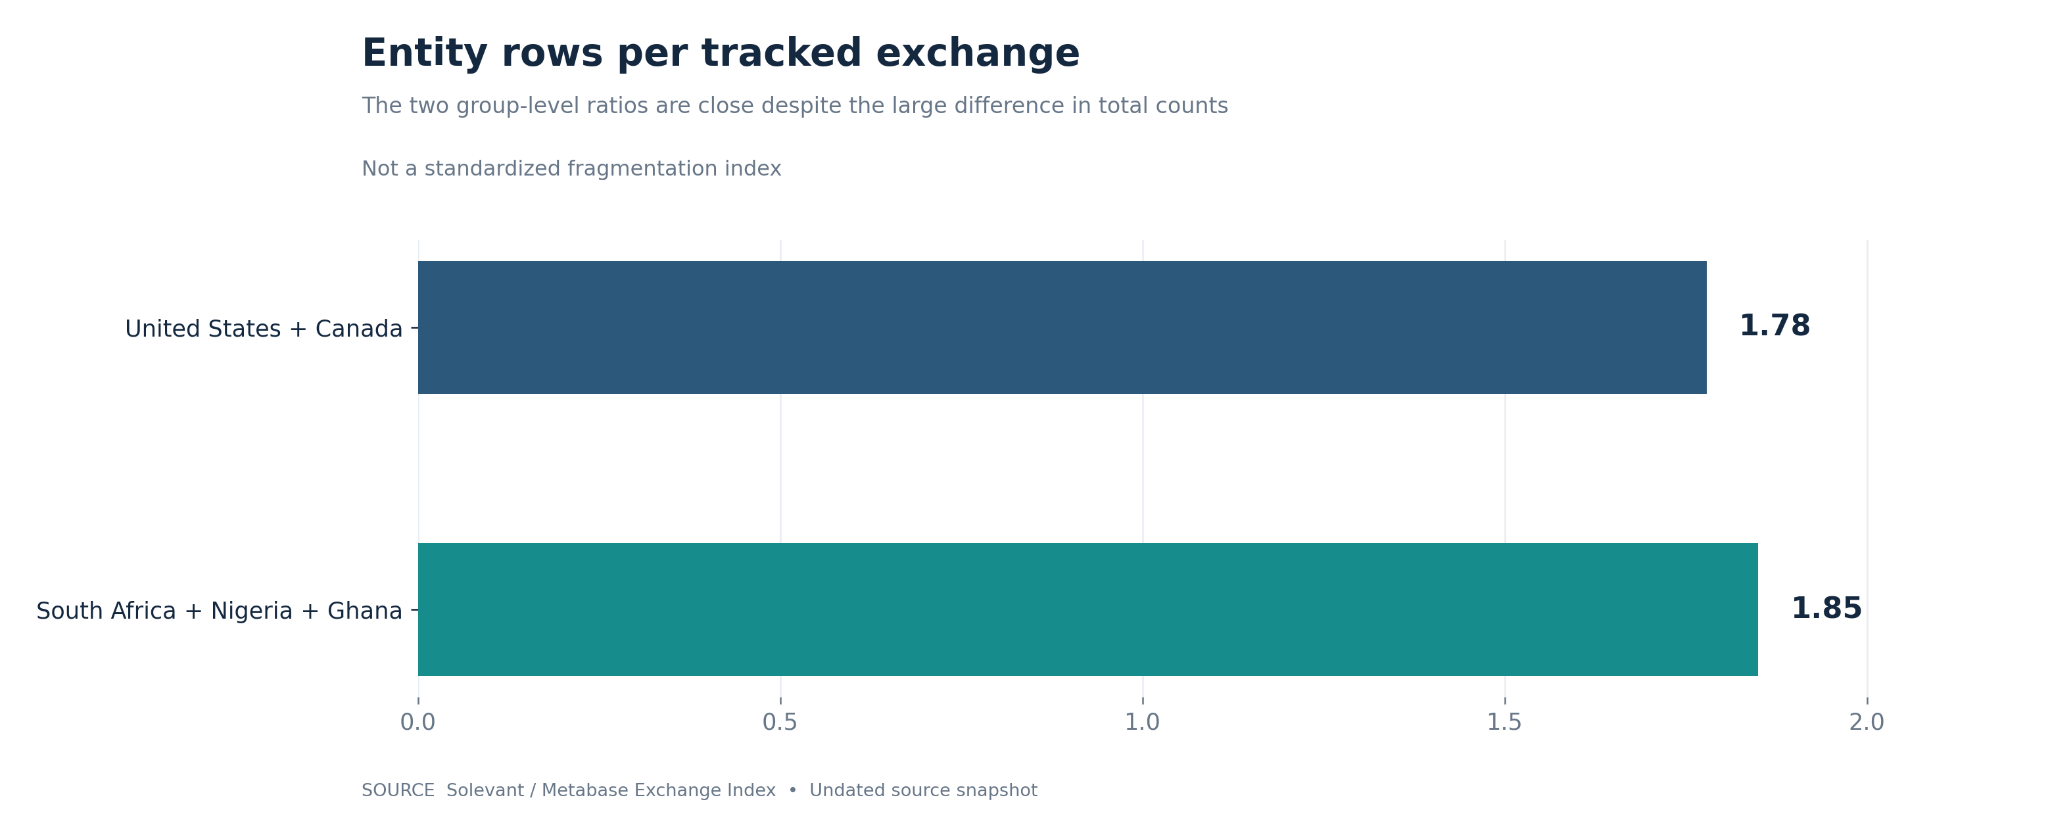
The ratios are similar, despite the much larger absolute North American total. This does not disprove the report's structural argument: market fragmentation could involve competition, routing, asset classes, regulation and liquidity that a simple rows-per-exchange calculation cannot capture. But it shows why the 28.7-to-one count difference should not be treated as a standalone fragmentation metric. To test the hypothesis properly, analysts would need a documented taxonomy of venue types, unique MIC definitions, parent-company relationships, jurisdiction-specific coverage rules and activity metrics. The supplied briefing provides none of those at record level.
Methodology and limitations
Source: Solevant, Exchange Index: African Markets vs. North America. The analysis draws on the Exchange Index dashboard. The source does not provide record-level data or an observation date. Geographic scope: The African group includes South Africa (ZA), Nigeria (NG) and Ghana (GH); the North American group includes United States (US) and Canada (CA). Neither filter covers its entire continent. Country-by-country counts are not published. Counting units: The report distinguishes tracked exchanges (574 versus 20) from total entity rows (1,021 versus 37). It does not fully define either unit or explain how venue identifiers, desks and parent organizations are deduplicated.
Status: North American rows sum to 834 Active, 185 Expired and two Updated; all 37 African-group rows are marked Active. These are status distributions at an undated snapshot, not observed historical survival, failure, closure or merger rates. Named identifiers: The report lists 17 JSE-associated entries and seven North American venue identifiers with counts. The underlying records and mappings were not supplied for independent verification. The JSE figure is an entry count, not a count of distinct exchanges. Excluded measures: The report supplies no comparable trading-volume, liquidity, capital-raising, market-capitalization or issuer-count data. Its explanations involving statutory permanence, institutional resilience, venture-capital turnover and consolidation are hypotheses or editorial interpretations, not findings established by the tables.
Frequently asked questions
How many exchanges does Solevant track in the selected African markets?
The briefing reports 20 tracked exchanges and 37 entity rows across South Africa, Nigeria and Ghana. It does not provide a total for the entire African continent.
How many tracked exchanges are in the US and Canada sample?
The combined filter lists 574 tracked exchanges and 1,021 entity rows. Those figures reflect the index's definitions, not necessarily 574 traditional stock exchanges.
Are all African exchanges active according to the report?
All 37 entity records in the three-country African filter are labeled Active. The report does not establish that every exchange across Africa is operational or that none has closed historically.
Does an 18.1% Expired share mean North American exchanges are failing?
No. The US–Canada filter contains 185 records marked Expired, or about 18.1% of its entity rows. The report does not provide reasons, event dates or evidence that the label measures economic failure.
How many entries are associated with the Johannesburg Stock Exchange?
The source associates 17 of 37 African-group entries (45.9%) with the JSE's XJSE identifier. That is not a count of 17 separate JSE exchanges.
Which North American identifier has the most entries in the displayed list?
XNAS (Nasdaq) has 39, followed by XCBO (Cboe) with 32 and XNYS (NYSE) with 26, according to the seven examples shown in the briefing.
Does this dataset show which region trades more money?
No. The document reports exchange identifiers, entity rows, statuses and confidence ranges, but no trading volumes or market values.
Is the comparison current as of November 2026?
The report does not state an extraction date. Its figures should be attributed to an undated Solevant index snapshot, not presented as a verified live market inventory.
Conclusion
Solevant's Exchange Index records 574 tracked exchanges and 1,021 entity rows for the United States and Canada, compared with 20 tracked exchanges and 37 rows for South Africa, Nigeria and Ghana. All 37 African-group rows are labeled Active, while 185 North American rows are labeled Expired. The source also shows a concentration of African-group entries around XJSE and multiple named North American venue identifiers. The comparison describes directory coverage and recorded status. It does not establish superior market resilience, continent-wide exchange totals or differences in trading activity. Dated source records, clear entity definitions and verified venue histories would be needed for a deeper comparison of market infrastructure.
Source: Solevant, Exchange Index: African Markets vs. North America. Index observation date not supplied.