

SaaS Industries Served and Product Age: What the Data Reveals
How many industries does the average SaaS product claim to serve? For a considerable share of products in Solevant's directory, the answer is four. An analysis of 6,340 industry-tagged software products found that 2,487 list the same combination of Healthcare, Education, Finance, and Retail. Together, these products account for 39.2% of the tagged listings examined. The research also provides a separate look at software product age, revealing substantial differences between established categories such as Enterprise Resource Planning (ERP) and newer categories such as Cryptocurrency Wallets.
Key Takeaways
- Healthcare is the most frequently listed industry, appearing in 4,671 product records, followed by Education, Retail, and Finance.
- 45.5% of tagged products list exactly four industries, while only 9.9% list one.
- Healthcare, Education, Finance, and Retail form the most common exact industry combination, appearing in 2,487 product records.
- Among software categories with at least 50 products, average years since launch range from 4.4 for Insurance to 39.9 for 360 Degree Feedback.
- ERP products average 25.8 years since launch, compared with 8.9 years for Cryptocurrency Wallets.
Which Industries Do SaaS Products Most Commonly Serve?
Healthcare, Education, Retail, and Finance dominate the industry classifications in Solevant's data. Healthcare appears in 4,671 product records, followed by Education with 4,336, Retail with 4,263, and Finance with 4,246. The difference becomes particularly noticeable from the fifth-ranked industry onward.
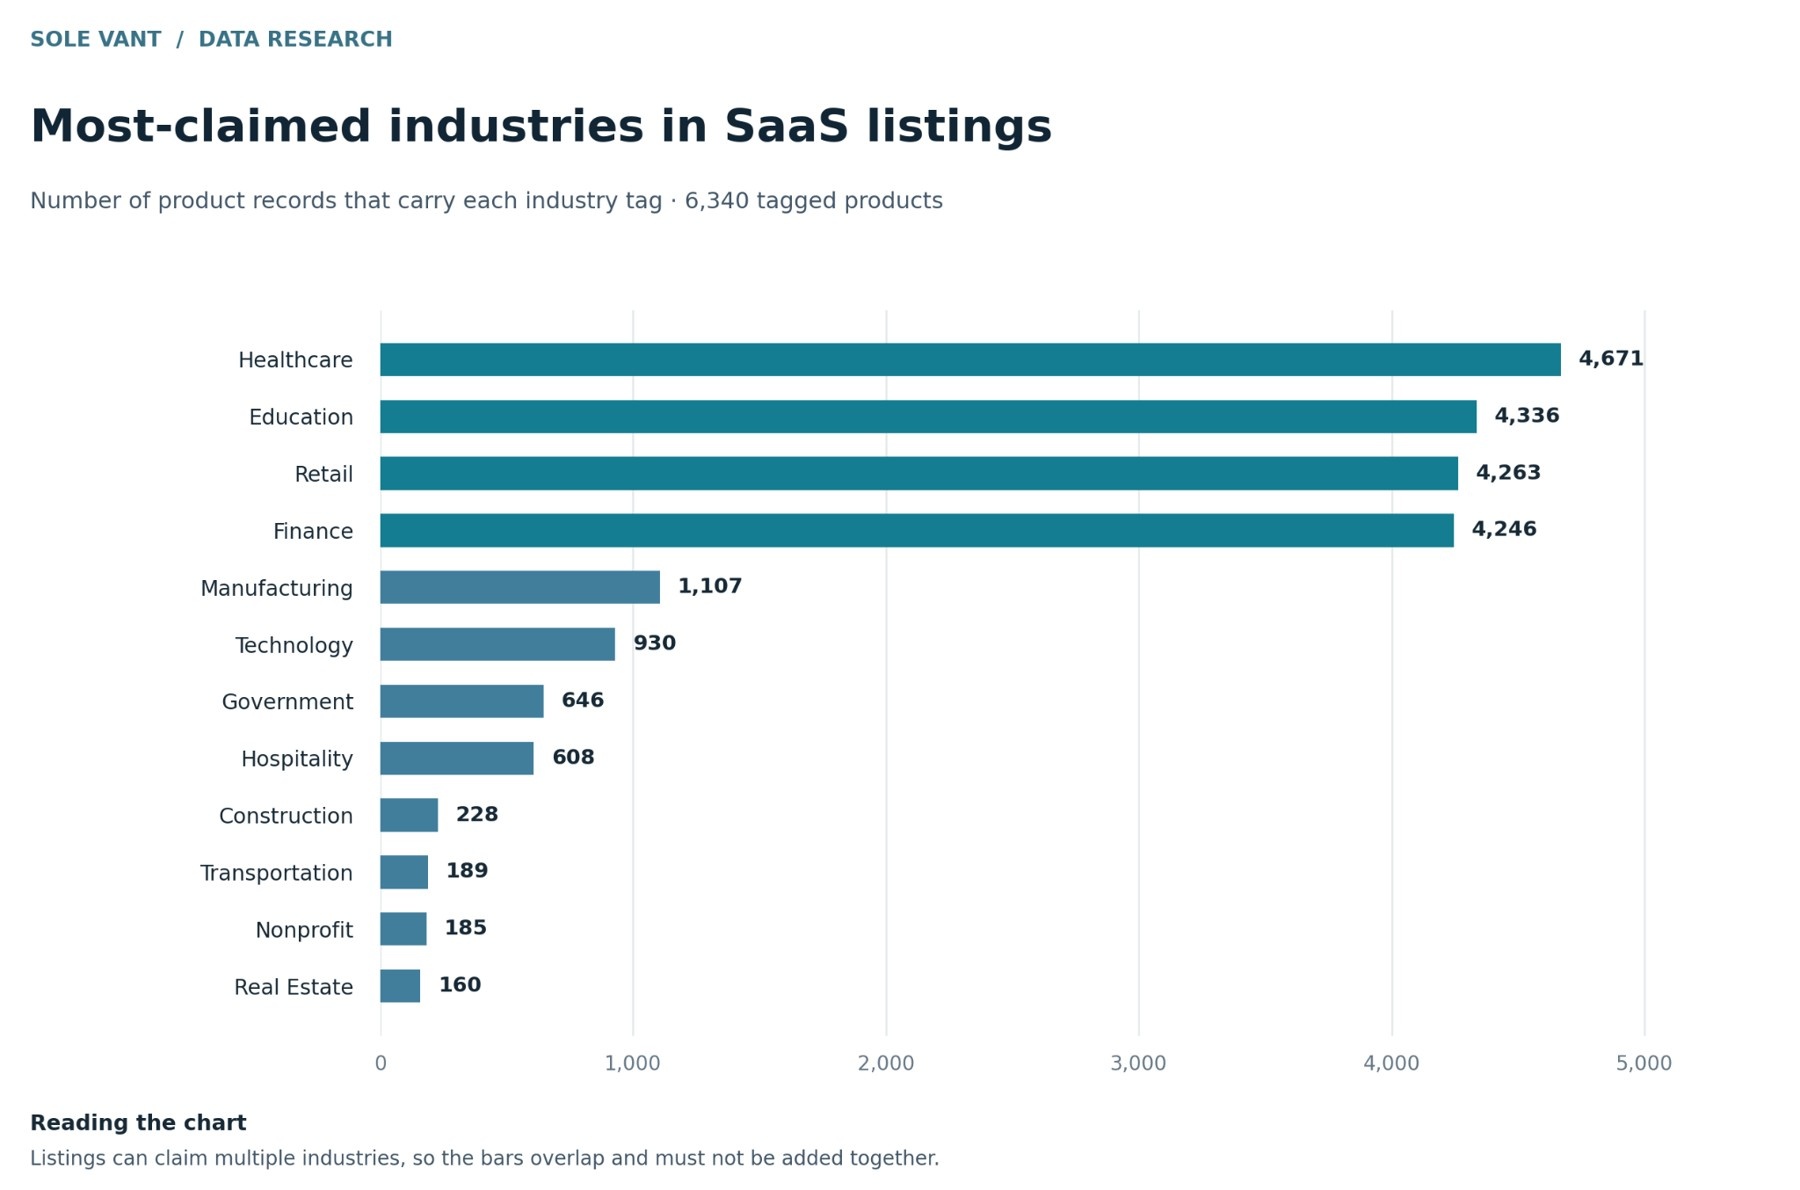
Manufacturing, the fifth most frequently listed industry, appears in just 1,107 product records. That's roughly one-quarter of the number recorded for Finance, the lowest-ranked of the leading four industries. Technology follows with 930 records, while Government and Hospitality appear in 646 and 608, respectively. These figures describe the industries that products claim to serve, rather than the number of customers or businesses using the software.
The counts also overlap because individual products can list several industries. A product classified under Healthcare, Finance, and Retail contributes to the recorded total for each of those industries. Consequently, the findings are best interpreted as a measure of declared industry coverage, not actual market penetration.
How Many Industries Does a Typical SaaS Product Claim to Serve?
Although software products can target one industry or several, four-industry listings are particularly common in the dataset. Of the 6,340 tagged products, 2,885 (45.5%) list exactly four industries. By comparison, 1,413 products (22.3%) list between one and three industries.
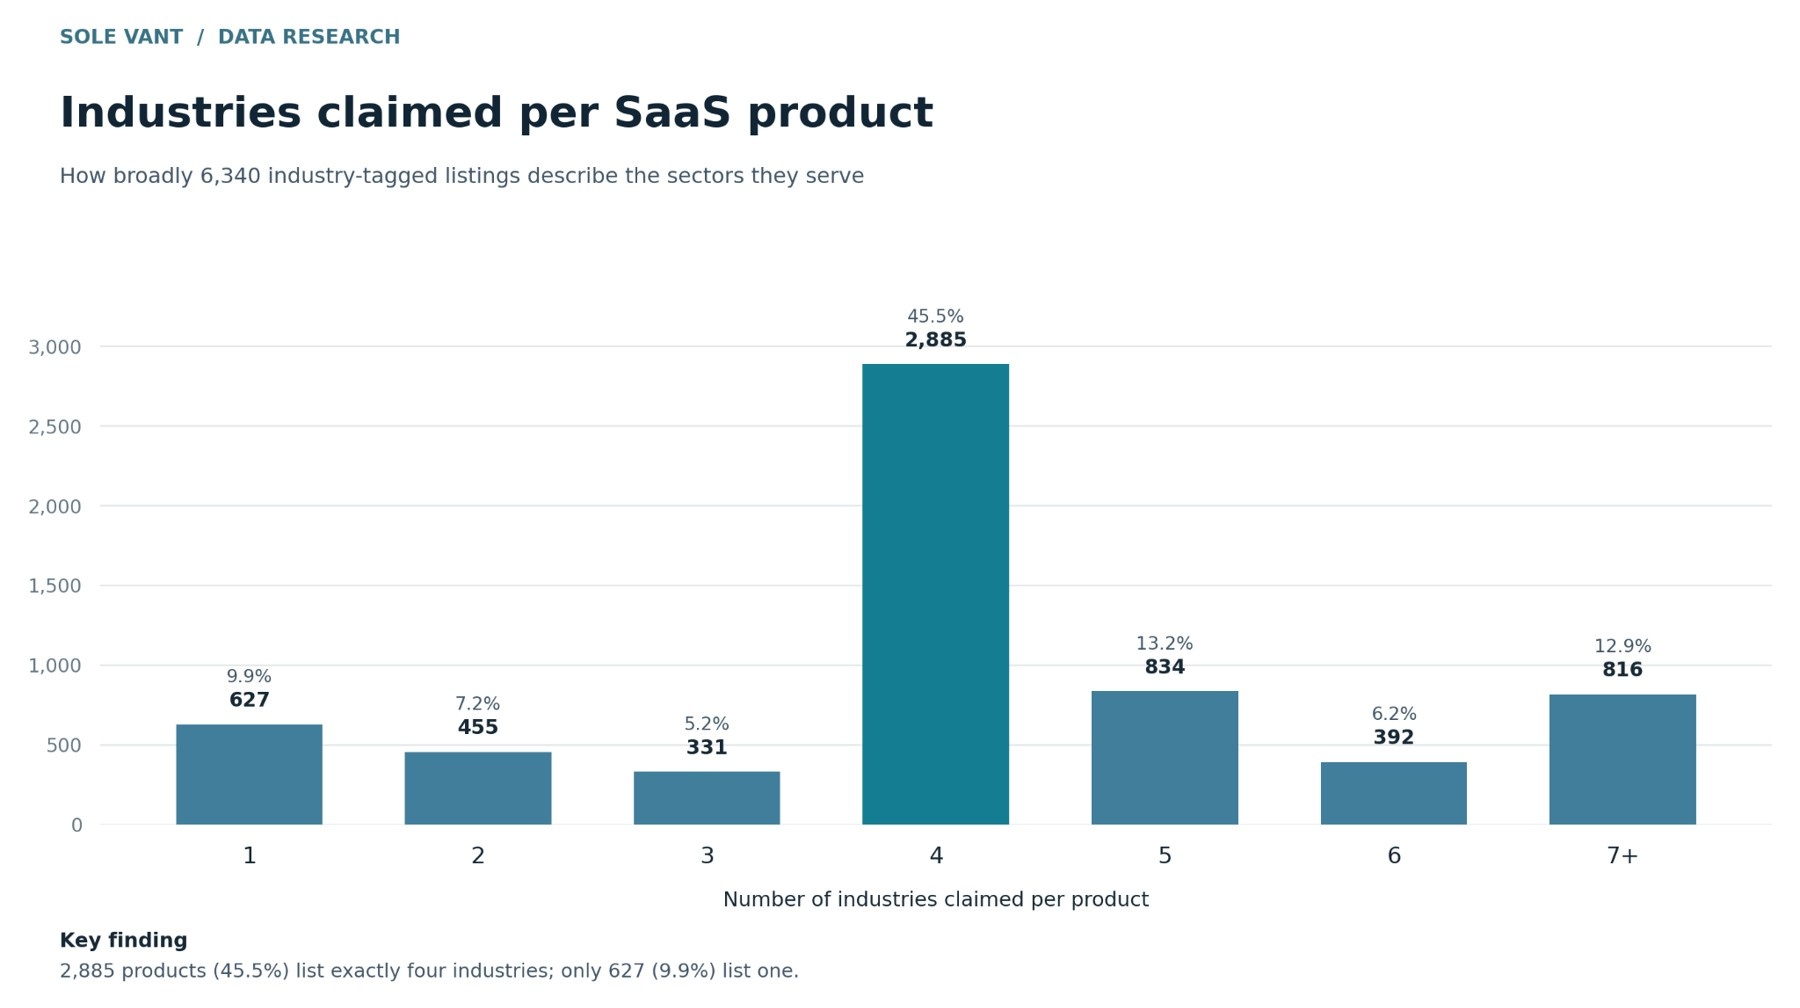
The difference is considerable. Products listing exactly four industries outnumber single-industry products by more than four to one. Only 627 products (9.9%) identify a single industry, while 2,042 (32.2%) list five or more. Among the single-industry listings, Healthcare appears most frequently, with 118 products. Education follows with 55, while Hospitality accounts for 36. The distribution suggests that multi-industry classification is common among products with recorded industry information. However, it doesn't establish whether these products offer specialized functionality for every industry listed.
What Is the Most Common SaaS Industry Combination?
The most frequently recorded combination is Healthcare, Education, Finance, and Retail, appearing in 2,487 product records. No other exact combination comes close. The next most common adds Technology to those four industries and appears in 159 records. A further 144 products list the same four industries alongside Manufacturing.
Table: Common Industry Combinations in SaaS Listings
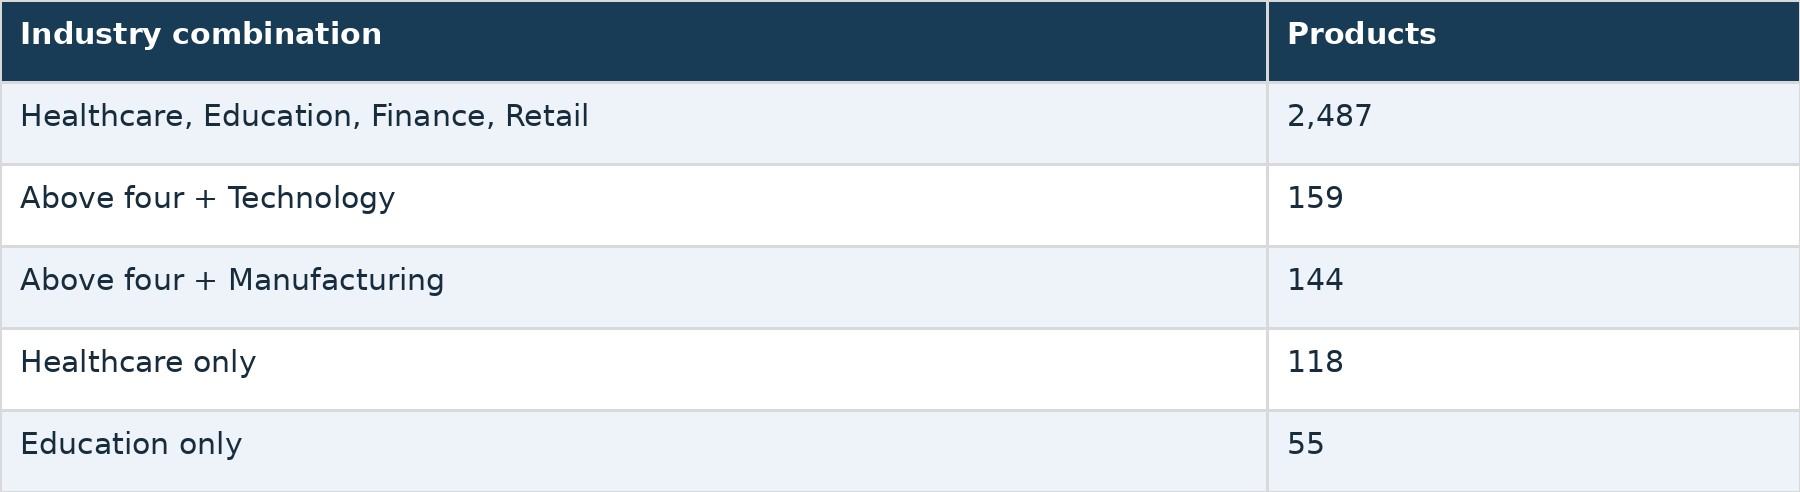
The substantial difference between the leading combination and the others is one of the report's most distinctive findings. However, it also raises an important data-quality consideration. A large number of identical industry classifications could reflect a common tagging convention rather than identical product capabilities. The source also includes 64 records with a punctuation variation of the leading combination. These are recorded separately in the original analysis, so the leading figure should be treated as an exact-label count until the underlying data can be standardized.
How Does Average SaaS Product Age Differ by Category?
Industry coverage is one way to compare SaaS products. Another is how long the products within different software categories have existed. A separate category-level analysis in the source report measures average years since product launch. To reduce the influence of very small samples, the comparison focuses on categories with at least 50 recorded products.
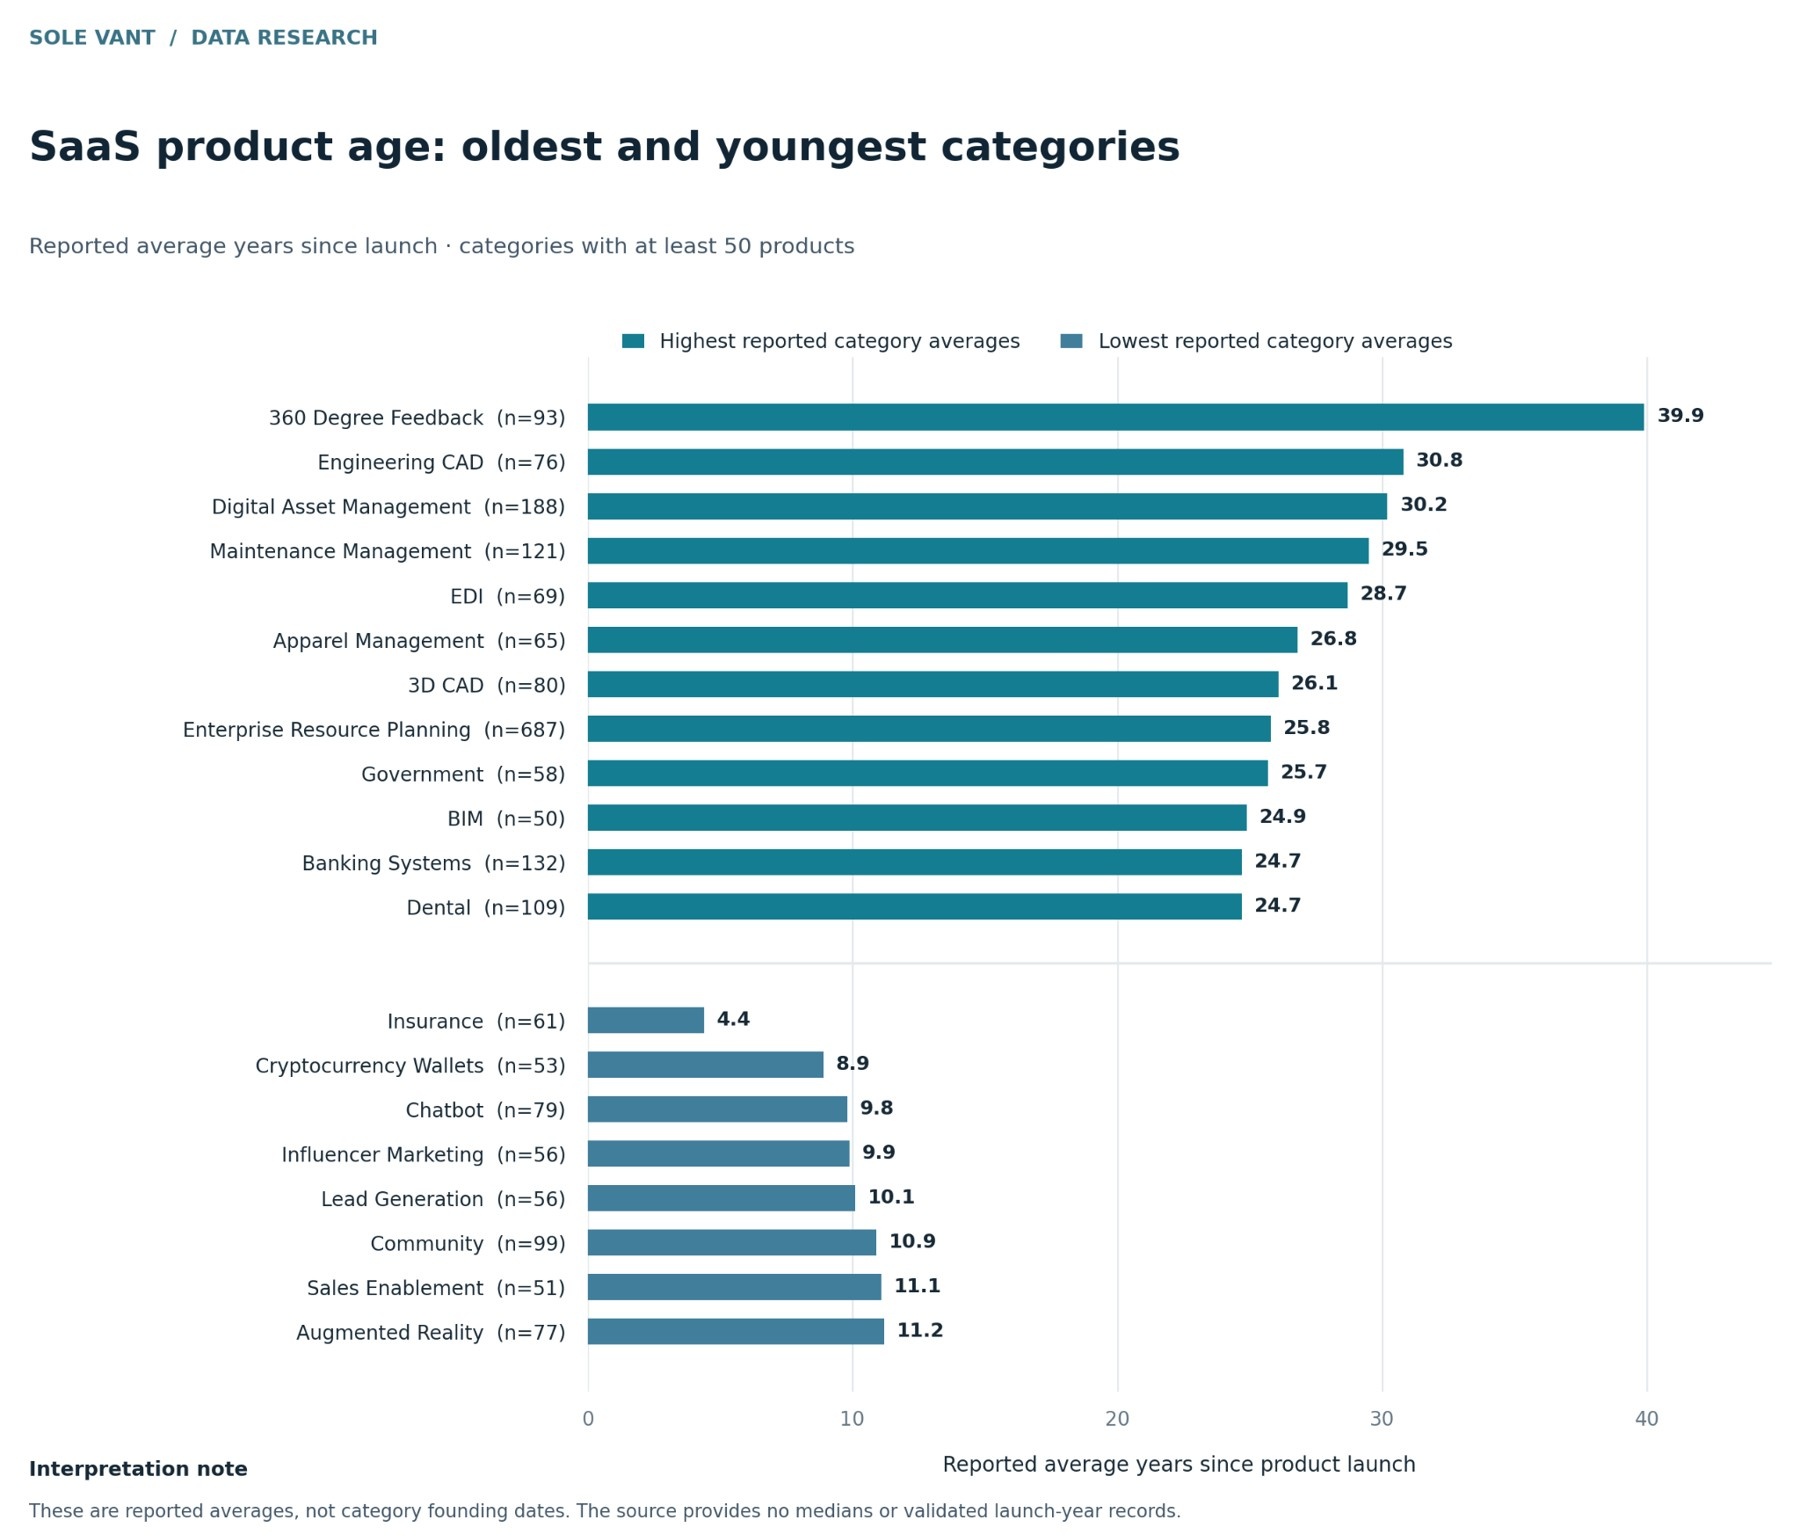
Among the categories examined, 360 Degree Feedback has the highest reported average product age at 39.9 years, based on 93 products. Engineering CAD follows at 30.8 years, while Digital Asset Management averages 30.2 years. ERP also stands out. Across 687 products, its average age is 25.8 years, considerably higher than several newer software categories. At the other end of the comparison, Insurance has the lowest reported average at 4.4 years across 61 products.
Cryptocurrency Wallets average 8.9 years, followed by Chatbot software at 9.8 years and Influencer Marketing at 9.9 years. The difference illustrates how much average product age can vary between categories. However, it does not establish that every product in an older category is mature or that every product in a younger category is recently launched. These are category averages, not individual product ages or the age of the software category itself.
What Do These Findings Reveal About SaaS Products?
The industry data shows that products frequently identify several target sectors, with four industries appearing especially often. Healthcare, Education, Finance, and Retail dominate the recorded classifications. The product-age data, meanwhile, reveals differences in average years since launch across software categories. Neither dataset establishes a direct relationship between the number of industries a product serves and its age. Nevertheless, both offer useful ways to examine how software products are represented and categorized within the directory.
Methodology and Data Limitations
This analysis is based on Solevant's SaaS Industries Served and Product Age report, which references Product_Age_and_insdustry_Report.xlsx. The industry analysis covers 6,340 tagged products across 999 recorded industry combinations. Industry counts reflect products carrying each relevant tag, meaning one product can contribute to several industry totals. The product-age analysis uses category-level averages, with the published comparison restricted to categories containing at least 50 products.
The source does not provide a reporting date, and some underlying industry combinations contain inconsistent labels. The report also notes that its supplied tables may omit rare combinations and that some smaller software categories contain implausible age values. The age data provides averages but not medians or a verified catalog-wide launch-year distribution. These limitations should be considered when interpreting the results.
Conclusion
Solevant's industry classifications show a strong concentration around Healthcare, Education, Finance, and Retail, with nearly half of tagged products listing exactly four industries. The separate product-age analysis reveals considerable differences across software categories, from established enterprise software to more recently launched product groups. Together, the findings offer useful insights into industry classification and software product age. More consistent industry labels, complete launch-year records, and updated product information would help support more detailed comparisons in future research.