
Asia SaaS Market: Countries, Pricing and Trends Across 3,673 Products
India accounts for nearly half of the SaaS products in Solevant's Asian software directory, considerably more than any other country represented in the dataset. An analysis of 3,673 products shows that India leads with 1,709 listings, followed by Japan, Israel, and China. However, product counts are only one part of the picture. The data also reveals differences in software categories, published monthly prices, and recorded product launch years.
Key Takeaways
- India accounts for 46.5% of the 3,673 SaaS products in the Asian dataset, followed by Japan (11.7%) and Israel (8.3%).
- Human Resources is the most represented software category with 94 products, followed by Enterprise Resource Planning (81) and CRM (77).
- Japan has the highest average listed monthly price among the ten countries compared, at $485.74, approximately twice India's $237.91.
- Among products with recorded launch years, 2016 had the highest number of launches at 99.
- Free-trial information is missing for 90.93% of products, limiting conclusions about how commonly vendors offer trials.
Which Asian Countries Have the Most SaaS Products?
India leads Solevant's Asian SaaS catalog with 1,709 products, representing 46.5% of all listings. Japan ranks second with 430 products (11.7%), followed by Israel with 305 (8.3%) and China with 233 (6.3%). Malaysia and Singapore follow with 195 and 159 products, respectively.
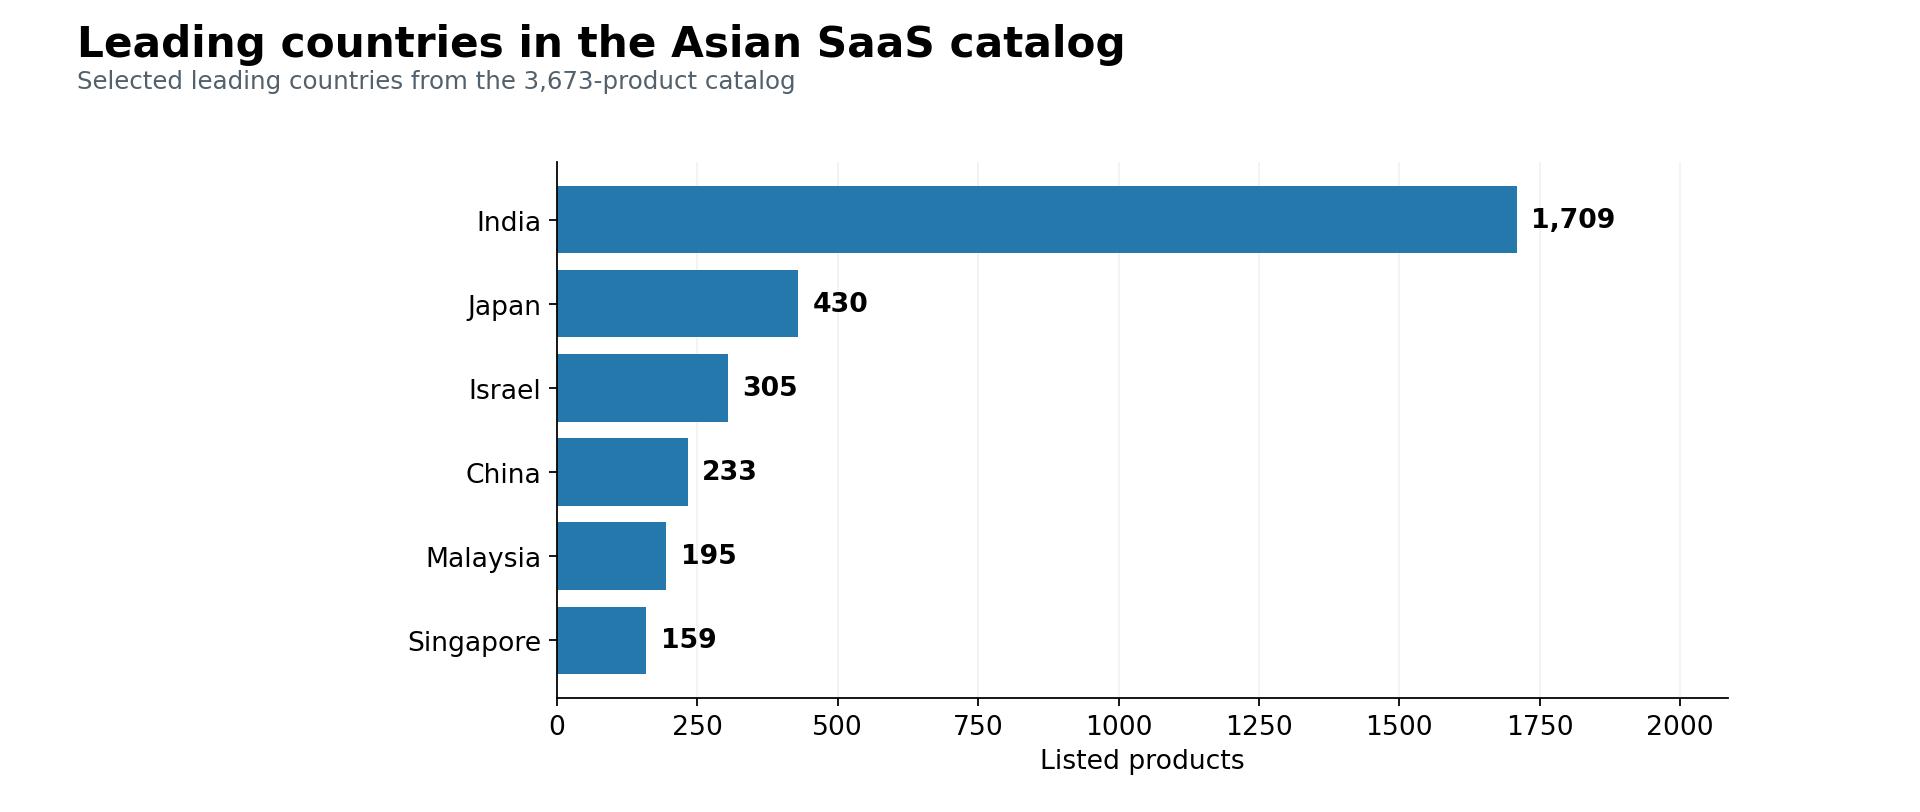
India's catalog contains nearly four times as many products as Japan's and more than the combined total of Japan, Israel, China, and Malaysia. The concentration extends beyond the leading country. The top 15 countries collectively account for 3,513 products, or approximately 95.6% of the dataset. The remaining 160 products are distributed across other countries represented in the directory. These figures show how unevenly SaaS products are represented across the Asian subset of Solevant's catalog. However, a higher listing count does not necessarily indicate a larger national SaaS market. Differences in directory coverage, product classification, and available records may influence the results.
What Are the Most Common SaaS Categories in Asia?
Human Resources leads the software categories in Solevant's Asian dataset, with 94 products. Enterprise Resource Planning (ERP) follows with 81 products, while Customer Relationship Management (CRM) ranks third with 77. School Management is the fourth-largest category, with 70 products.
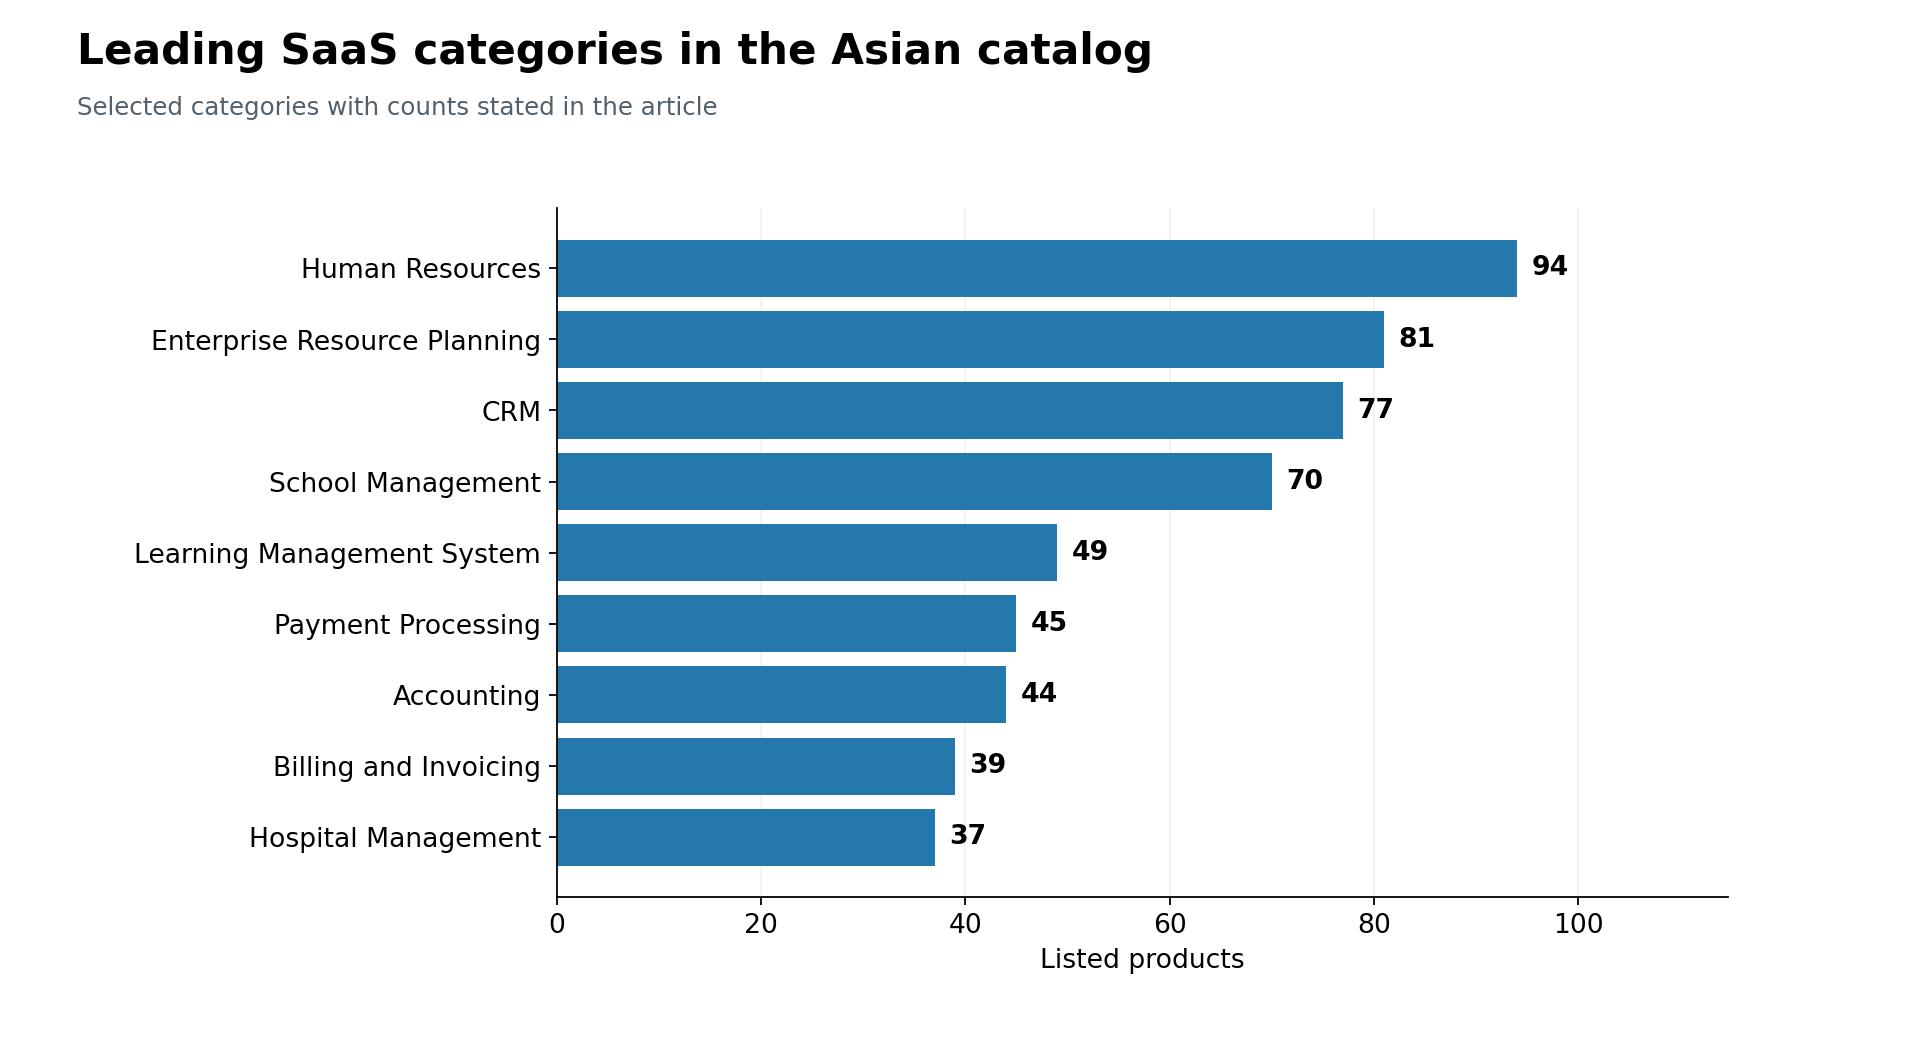
Other frequently recorded categories include Learning Management Systems (49), Payment Processing (45), Accounting (44), and Billing and Invoicing (39). The presence of School Management and Learning Management Systems among the leading categories is notable because both address specific education-related business needs. Similarly, Hospital Management appears among the top ten categories, with 37 products. These findings show that the directory includes both broad business applications, such as HR and ERP, and software designed for particular industries.
How Do Software Categories Differ Across India, Japan, and Israel?
The three countries with the highest product counts have different leading software categories.

India's next-largest categories are CRM (54 products) and Human Resources (45). In Japan, Enterprise Resource Planning and Billing and Invoicing each account for nine products, following Chatbot software. Israel's category distribution is more security-focused among its leading listings, with Network Security accounting for nine products and Cybersecurity for seven. These differences illustrate how the recorded category mix varies across countries, although the rankings alone do not establish broader national software demand or purchasing preferences.
How Much Does SaaS Software Cost Across Asian Countries?
Average listed SaaS prices differ considerably across the ten countries included in the report's pricing comparison. Japan has the highest average monthly price at $485.74, based on 31 priced products. India follows at $237.91 across 157 priced products, while China ranks third at $102.88 across 17.
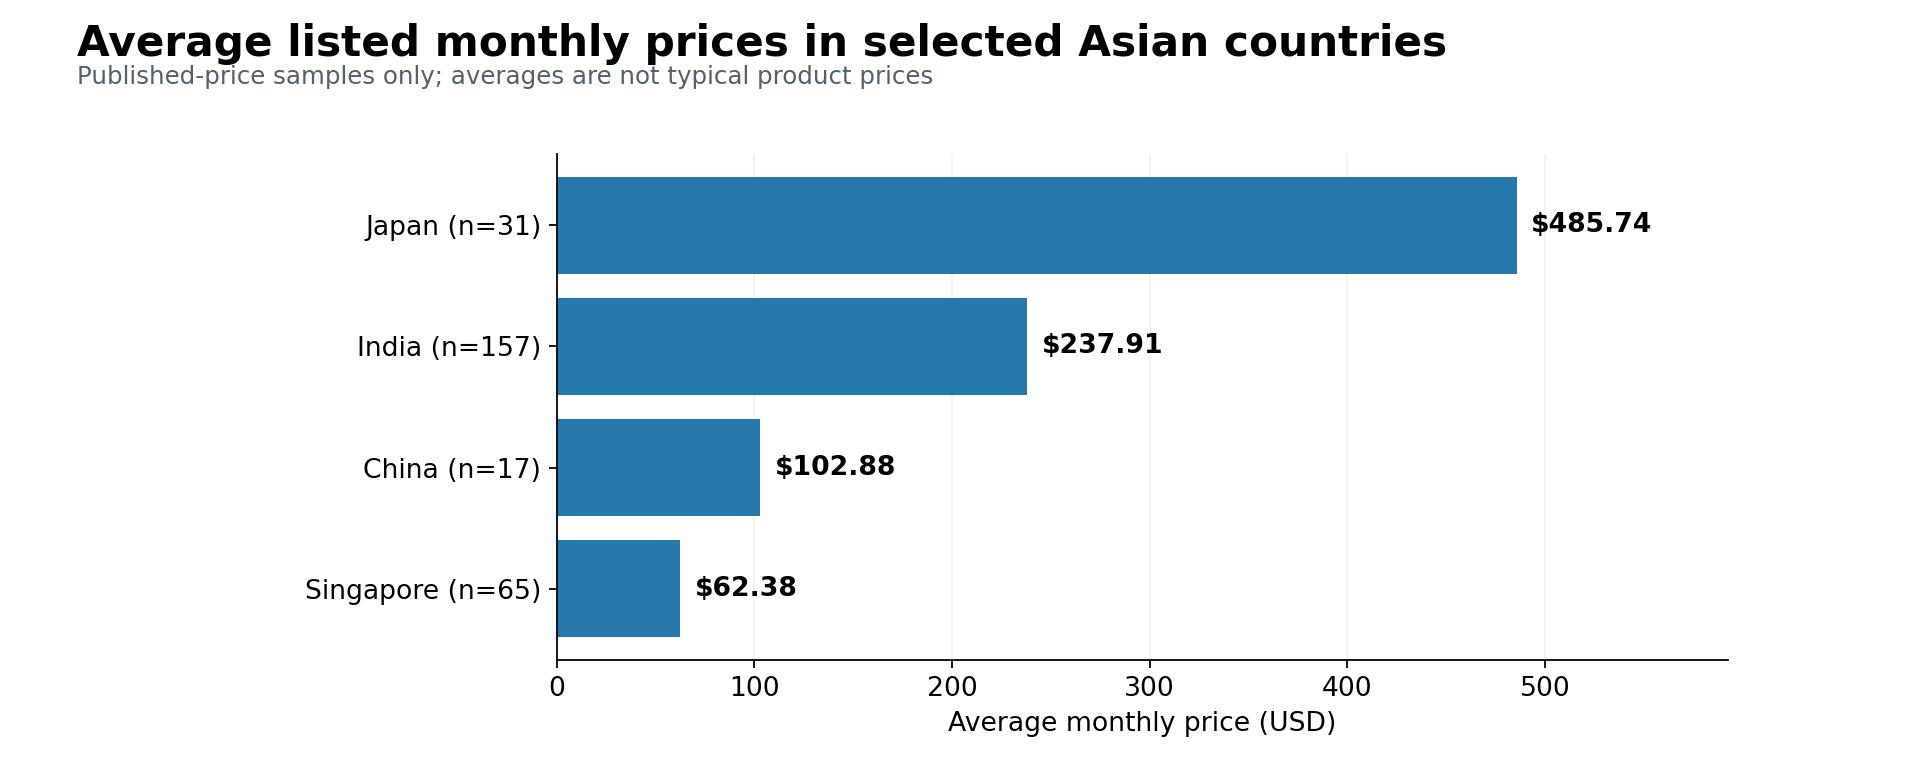
The differences are substantial, but averages alone don't tell the complete story. For example, India's median monthly price is just $37, compared with its average of $237.91. Japan shows an even wider gap, with a median of $25 against an average of $485.74. This indicates that relatively expensive listings raise the averages above the prices of typical products in the respective samples.
Singapore provides another comparison. Its average listed monthly price is $62.38, while its median is $29, based on 65 priced products. The results should be interpreted carefully because the number of priced products differs considerably between countries. Vietnam, for example, has only six priced products in the comparison. The analysis also excludes verified pricing extraction errors and applies a $5,000 monthly price cap.
Which SaaS Categories Have the Highest Average Prices?
Call Center software records the highest average monthly price among the categories examined, at $1,684.67. Field Service Management follows at $1,261.25, while Learning Management Systems average $1,083. However, these averages are based on just three or four priced products per category. The differences between averages and medians are also substantial. Call Center software has a median price of $29 despite its $1,684.67 average. This suggests that a small number of expensive products strongly influence the category average. Consequently, these figures are more useful for identifying pricing variation within the available listings than for establishing representative SaaS prices across entire software categories.
When Were the Most SaaS Products Launched in Asia?
Among the 1,405 products with recorded launch years, 2016 had the highest number of launches, with 99. The data shows a general increase in recorded launches through the 2010s, followed by lower counts in the early 2020s.
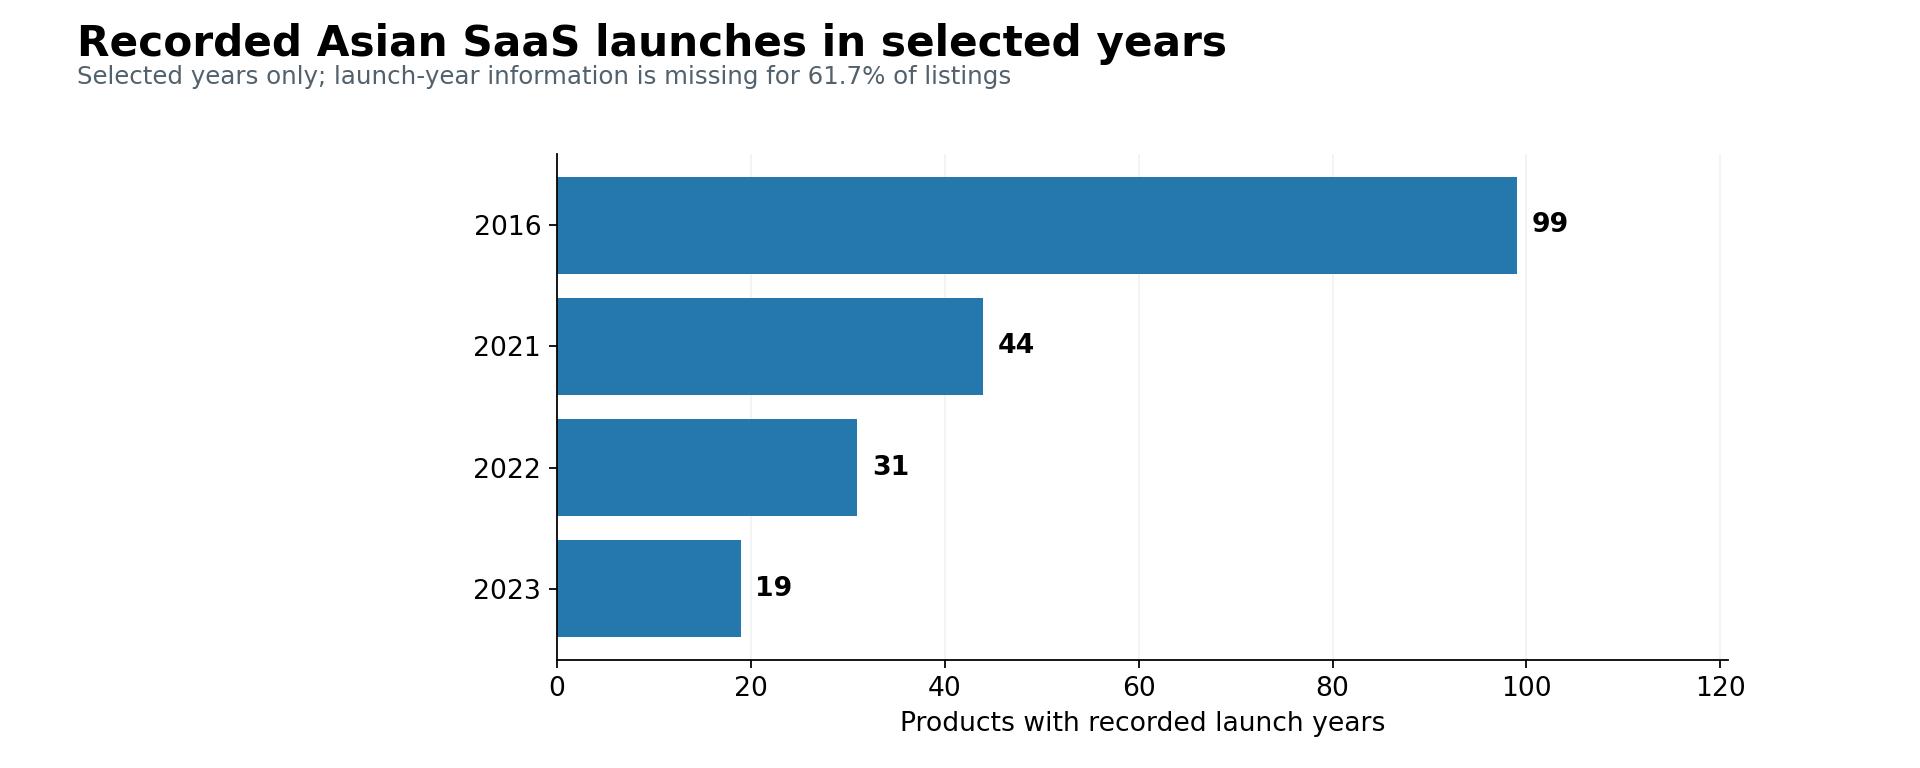
Between 2016 and 2020, the directory records 419 launches, accounting for 29.8% of products with known launch years. The preceding period, 2010–2015, accounts for another 396 launches. Together, these periods represent approximately 58% of all dated product records. More recently, the dataset records 44 launches in 2021, 31 in 2022, and 19 in 2023.
However, these figures should not be interpreted as evidence that SaaS company formation or product development across Asia declined at the same rate. Launch-year information is missing for 2,268 products, representing 61.7% of the catalog. The recorded timeline therefore describes only a subset of the products analyzed.
How Common Are Free Trials Among Asian SaaS Products?
Free-trial information is another area where the directory has limited coverage. Of the 3,673 products analyzed, 262 (7.13%) explicitly indicate that a free trial is available. Another 71 products (1.93%) state that no free trial is offered. For the remaining 3,340 products, representing 90.93% of the dataset, free-trial status is not recorded. This makes it difficult to determine how widespread free trials actually are among the products listed. The 7.13% figure represents products with a recorded free-trial offering, not the overall proportion of Asian SaaS vendors that provide trials.
Methodology and Data Limitations
This analysis is based on Solevant's Asian SaaS directory subset, comprising 3,673 product listings. The source report identifies Geographic_data__Asia.xlsx as its underlying workbook. Country and category comparisons use product counts from the supplied summary tables. Monthly pricing is expressed in US dollars and calculated using products with recorded prices. The analysis applies a $5,000 monthly price cap and excludes four entries identified in the source report as data-extraction errors.
Launch-year analysis covers 1,405 products with recorded dates between 1990 and 2024. Another 2,268 products have no recorded launch year. Free-trial information is also incomplete, with 90.93% of product listings lacking a recorded status. The source report does not specify a data collection period or update frequency. Accordingly, these results describe the supplied directory records rather than current or comprehensive measures of the Asian SaaS market.
Conclusion
Solevant's Asian SaaS dataset reveals a strong concentration of product listings in India, with Japan, Israel, and China accounting for much of the remaining leading-country coverage. Human Resources, ERP, and CRM are the most represented software categories, while country-level comparisons show notable differences in category rankings and published prices. The launch-year and free-trial findings provide additional context, although incomplete records limit broader conclusions. Together, the data offers a useful view of how SaaS products are distributed and described within Solevant's Asian directory, while highlighting the need for more complete records to support wider market comparisons.