SaaS Software Status and Pricing: 101,781 Products Analyzed
How many SaaS products are listed as active, under development, discontinued, or sold? And how do their recorded monthly prices compare? Solevant's SaaS Software Status and Pricing report examines 101,781 software product listings across five lifecycle-status labels. The dominant group is Active, with 84,919 products. Development products have the highest recorded average monthly price at $294.46, while Discontinued products have the lowest at $89.14. These figures describe catalog labels and prices recorded in the directory. They do not measure product survival over time, actual transaction prices, or the likelihood that a particular SaaS product will be discontinued.
Key findings
- 84,919 products are marked Active, approximately 83.4% of the catalog.
- 9,831 products carry an UNKNOWN status, making it the second-largest group.
- 4,001 products are in Development; 1,761 are Discontinued and 1,269 are Sold.
- Discontinued and Sold together account for 3,030 listings, approximately 3% of the catalog.
- Development has the highest recorded average monthly price at $294.46, $27.36 above Active.
- Active products average $267.10 per month among listings with a recorded price.
- Discontinued products have the lowest recorded average at $89.14 per month.
- CRM is the largest product category, with 1,179 listings, followed by Payment Processing (1,142) and Enterprise Resource Planning (1,045).
- 1,995 listings have no category assignment.
What does SaaS software status mean in this report?
The report groups each product into one of five recorded status labels: Active, Development, Discontinued, Sold, and UNKNOWN. The labels describe how products are classified in the Solevant catalog. The source does not supply detailed rules for assigning or updating these statuses. For example, a product marked Sold is not necessarily discontinued, and a Development label does not establish when the product will launch. Likewise, an UNKNOWN label means the report cannot establish the product's status from the available field.
Because the data is a single snapshot without a reporting date, it cannot be used to calculate annual SaaS failure rates, churn rates, or the length of a product's lifecycle.
How many SaaS products are active, discontinued, or in development?
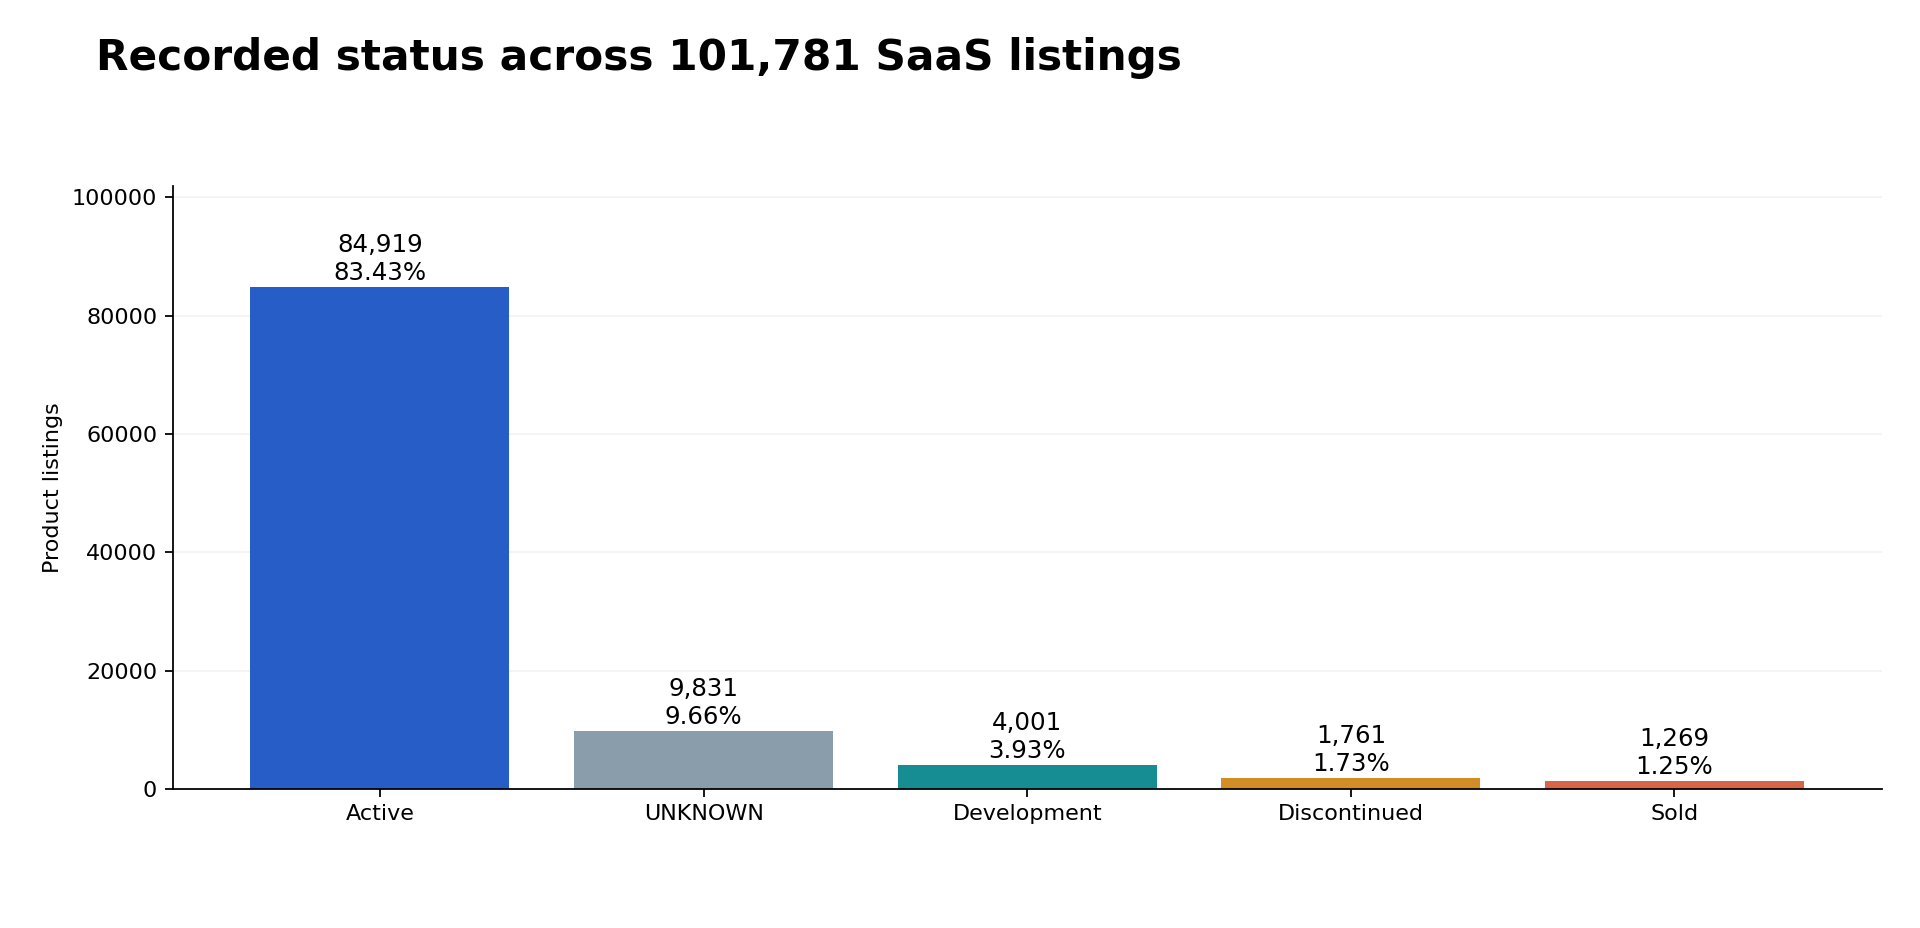
Active products overwhelmingly dominate the status distribution. The report records 84,919 Active listings, compared with 9,831 UNKNOWN and 4,001 Development listings.
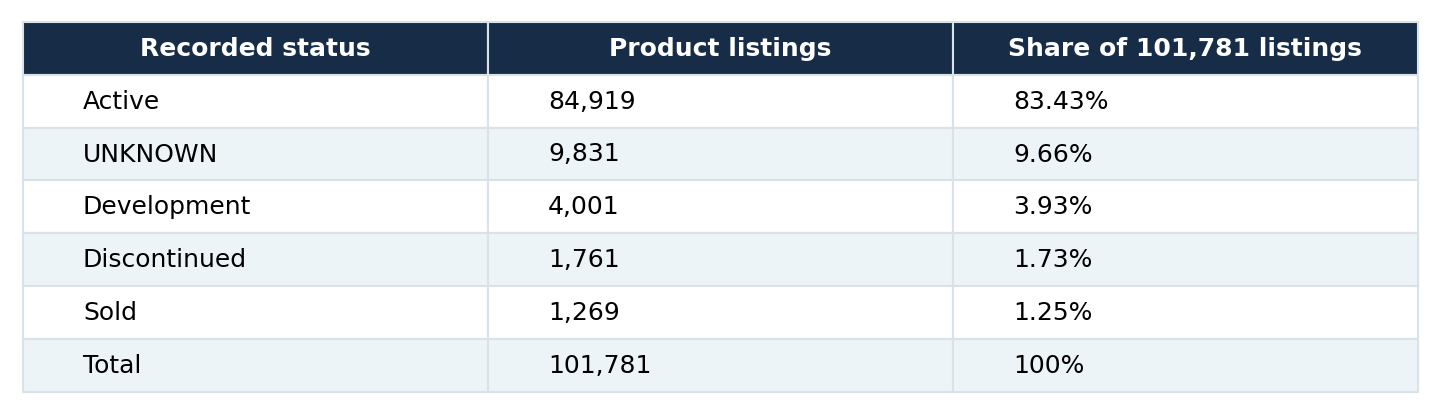
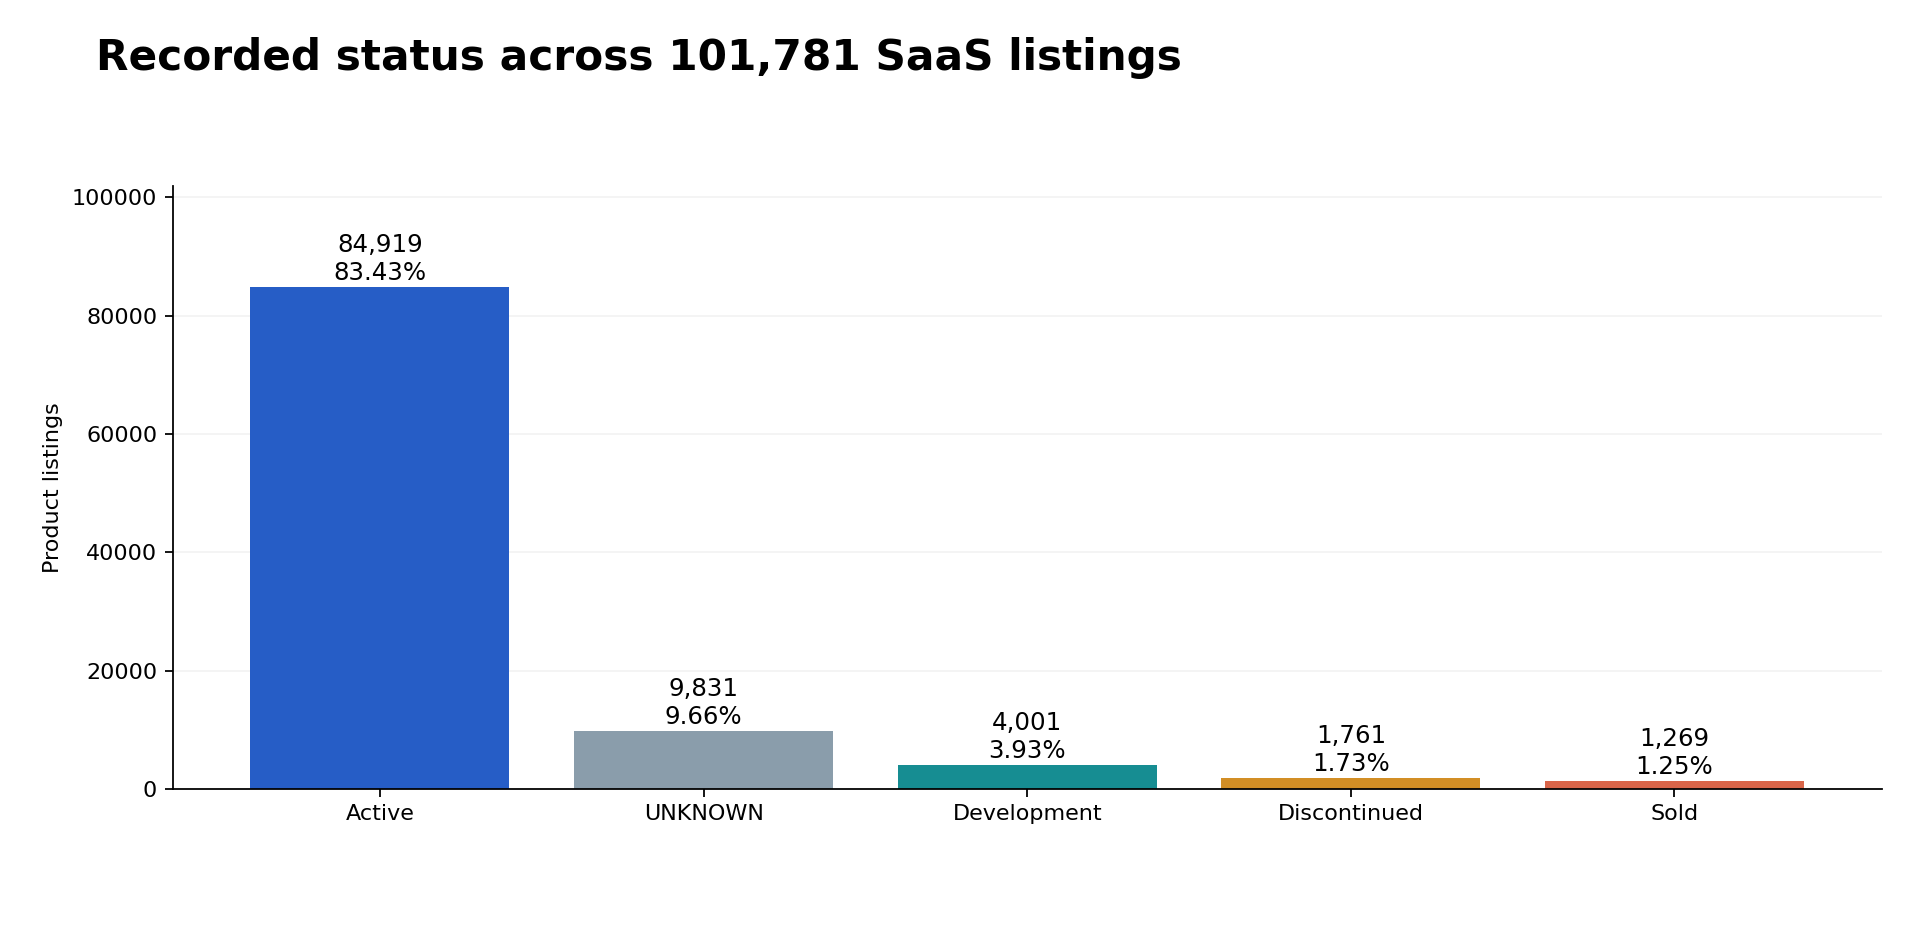
Active is the largest status group, with 84,919 products. Percentages are calculated from the recorded counts and the 101,781-listing total.
The UNKNOWN group is especially important. Its 9,831 listings outnumber Development, Discontinued, and Sold combined, which total 7,031. This means the catalog's second-largest status category provides no confirmed lifecycle classification. The 3,030 Discontinued and Sold listings represent approximately 3% of the directory, but that figure should not be called a SaaS failure or churn rate. Sold is a separate recorded status, and the report does not track transitions over time.
Why the unknown-status group matters
A recorded Active share of about 83.4% is the share explicitly marked Active. The 9,831 UNKNOWN listings could contain products with different real-world statuses, but the report does not identify them. Consequently, the dataset supports a count of known Active listings, not a definitive census of every currently operating product in the catalog.
How does average monthly SaaS pricing differ by status?
Development products have the highest recorded average monthly price, at $294.46. Active products follow at $267.10. The remaining three groups have much lower recorded averages.
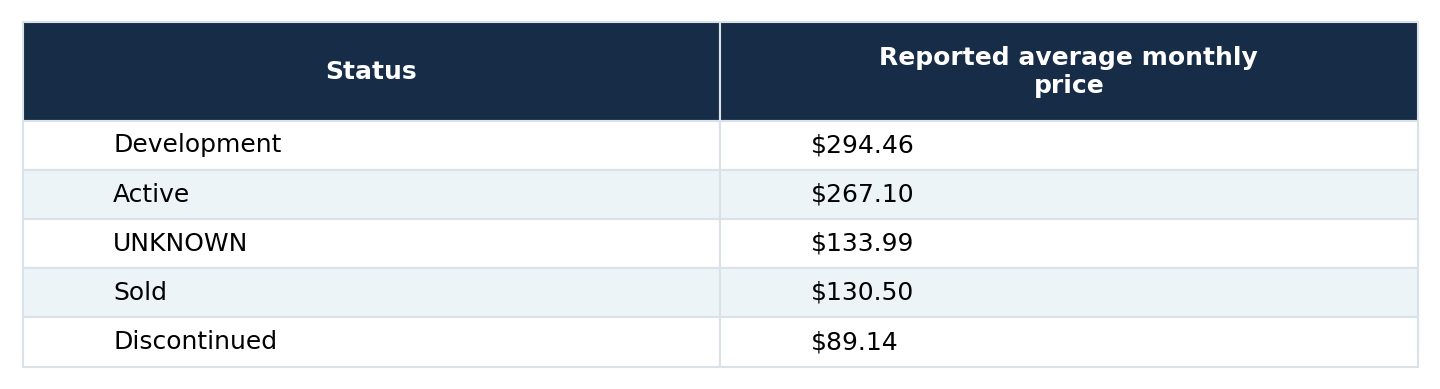
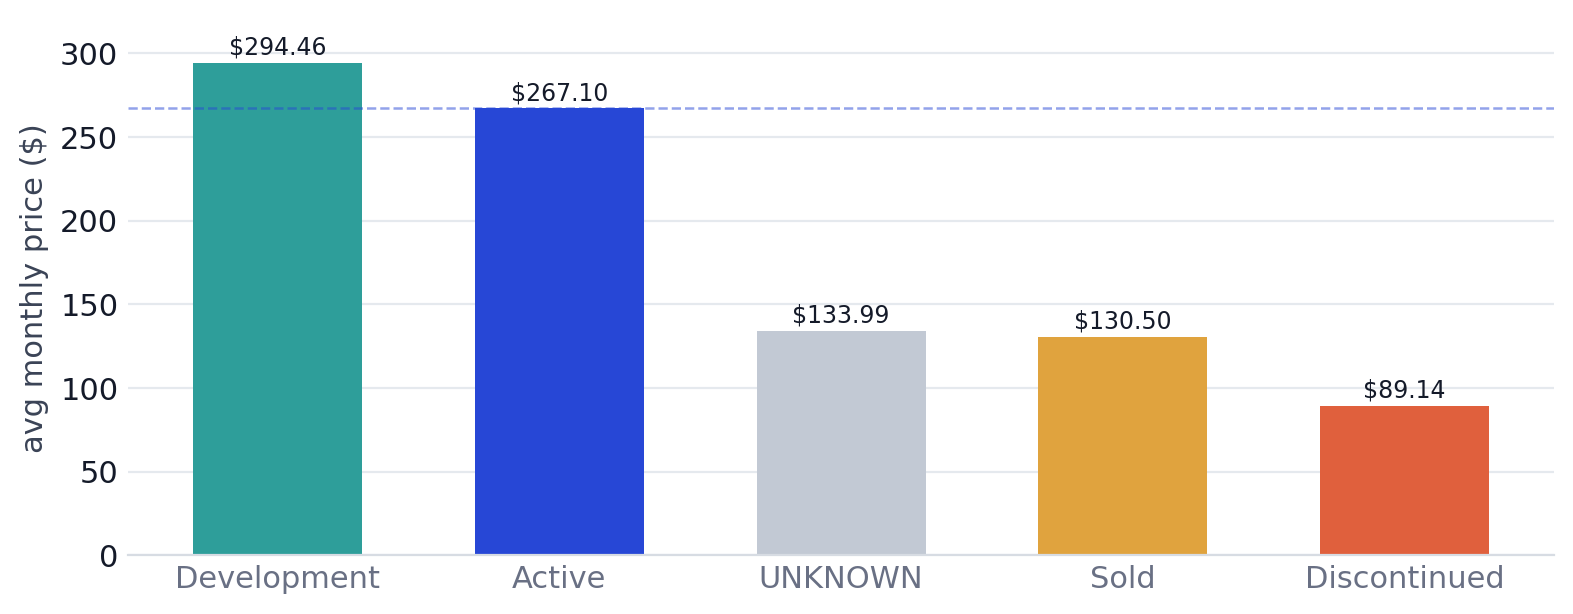
Development has the highest average recorded monthly price at $294.46. The averages include only listings with a price on record, not all products in each status group.
The difference between the highest and lowest reported averages is $205.32 per month. Discontinued products average about one-third of the Active average, but this is a comparison between different priced subsets, not a controlled comparison of otherwise similar software products. The source does not give the number of priced products within each status. Without those denominators, it is impossible to assess how representative or stable the five averages are.
How far are other statuses from the Active price average?
Using the Active average of $267.10 as a baseline makes the differences easier to compare.
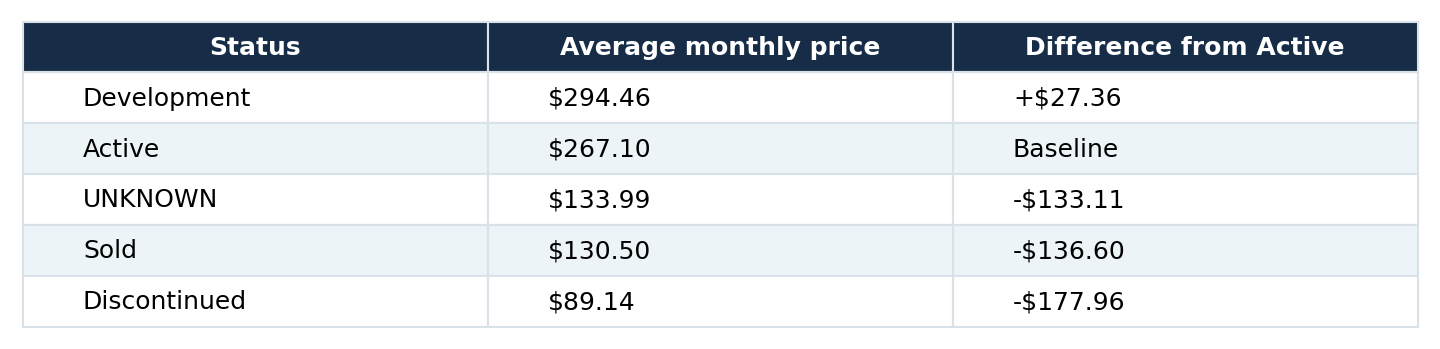
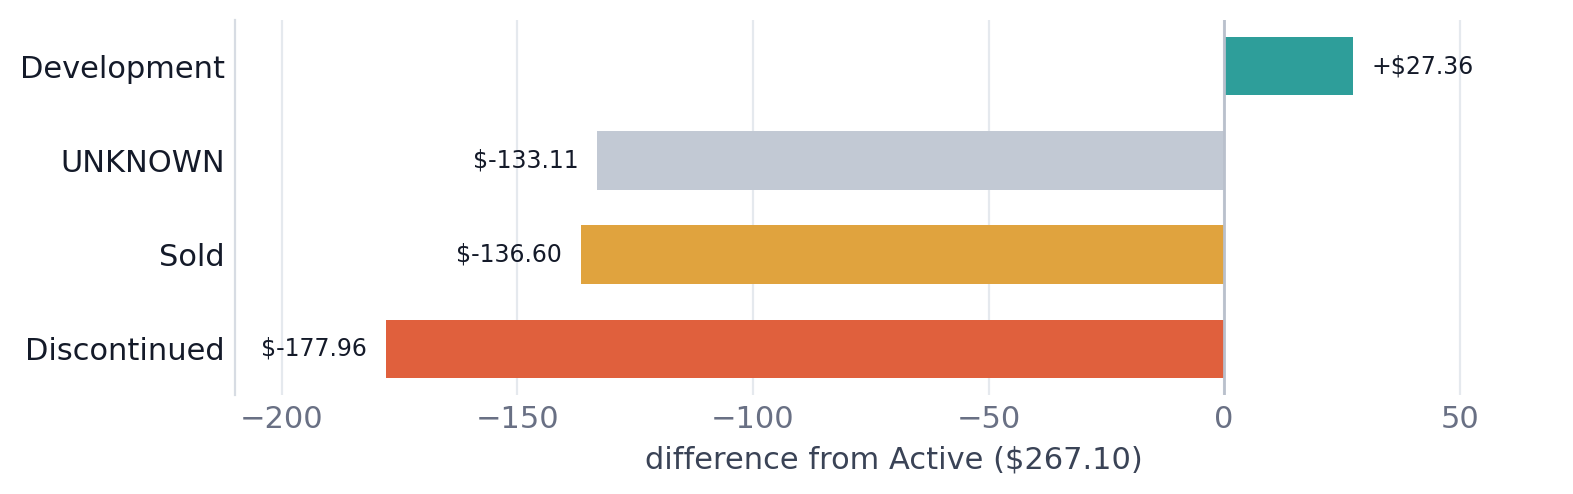
Development is the only group above the Active average. Discontinued is $177.96 below Active, based on the report's recorded priced products.
Development is $27.36 above Active, while UNKNOWN and Sold are close to one another, differing by just $3.49. These gaps are descriptive. The data does not establish that being in Development causes a higher price, that low prices cause discontinuation, or that changing a product's status would change what customers pay.
Can discontinued products still have prices in the directory?
Yes. The report explicitly states that the $89.14 Discontinued average comes from Discontinued products that still have a recorded price. Many Discontinued listings no longer carry one. As a result, the $89.14 figure should not be treated as the average historical selling price of every discontinued product, or as a typical price for software about to shut down.
What are the largest SaaS software categories?
Alongside lifecycle status and pricing, the report ranks product categories by the number of listings in the catalog. CRM leads with 1,179 products, narrowly ahead of Payment Processing (1,142) and Enterprise Resource Planning (1,045). Project Management and Learning Management System complete the top five.
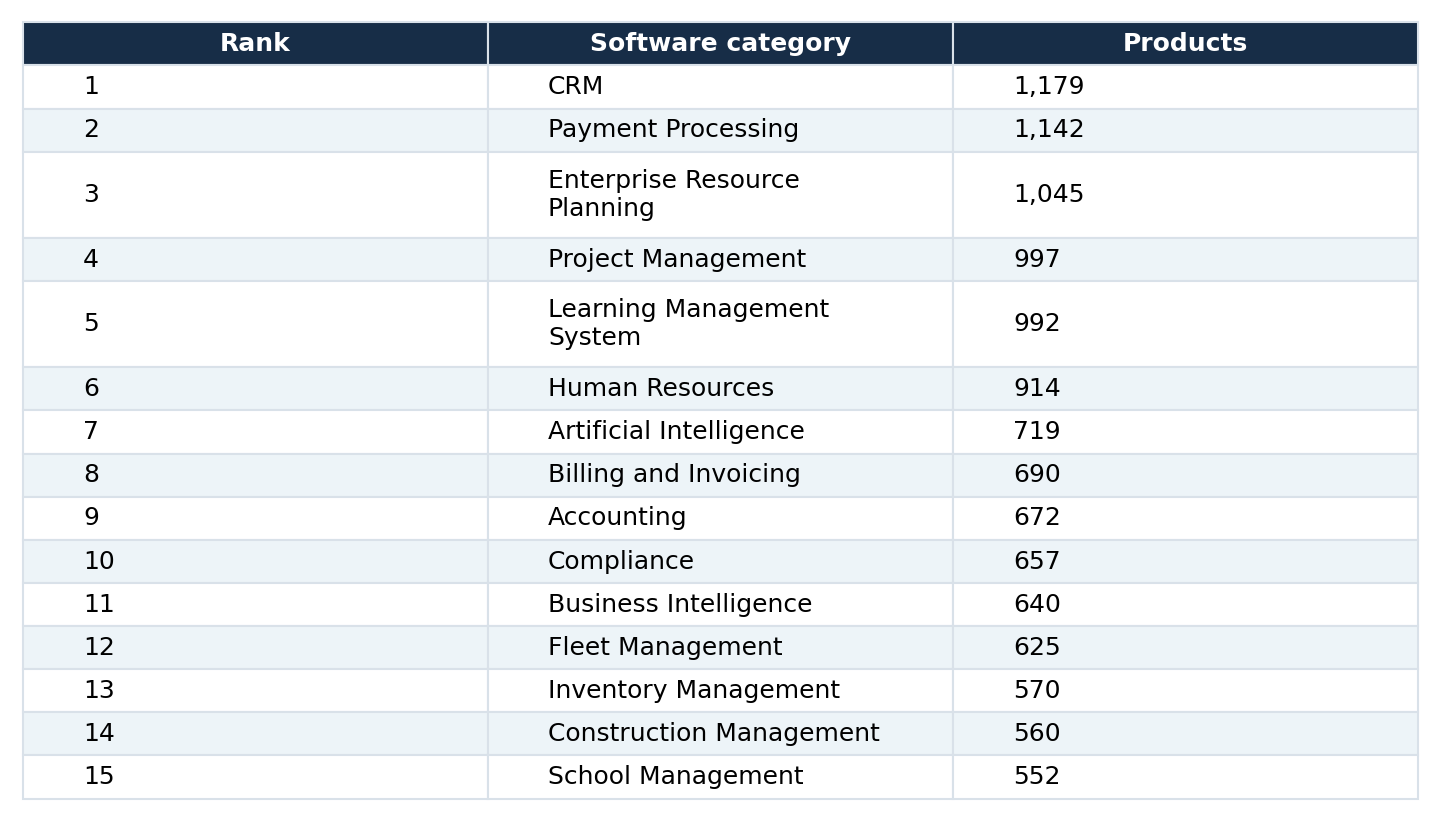
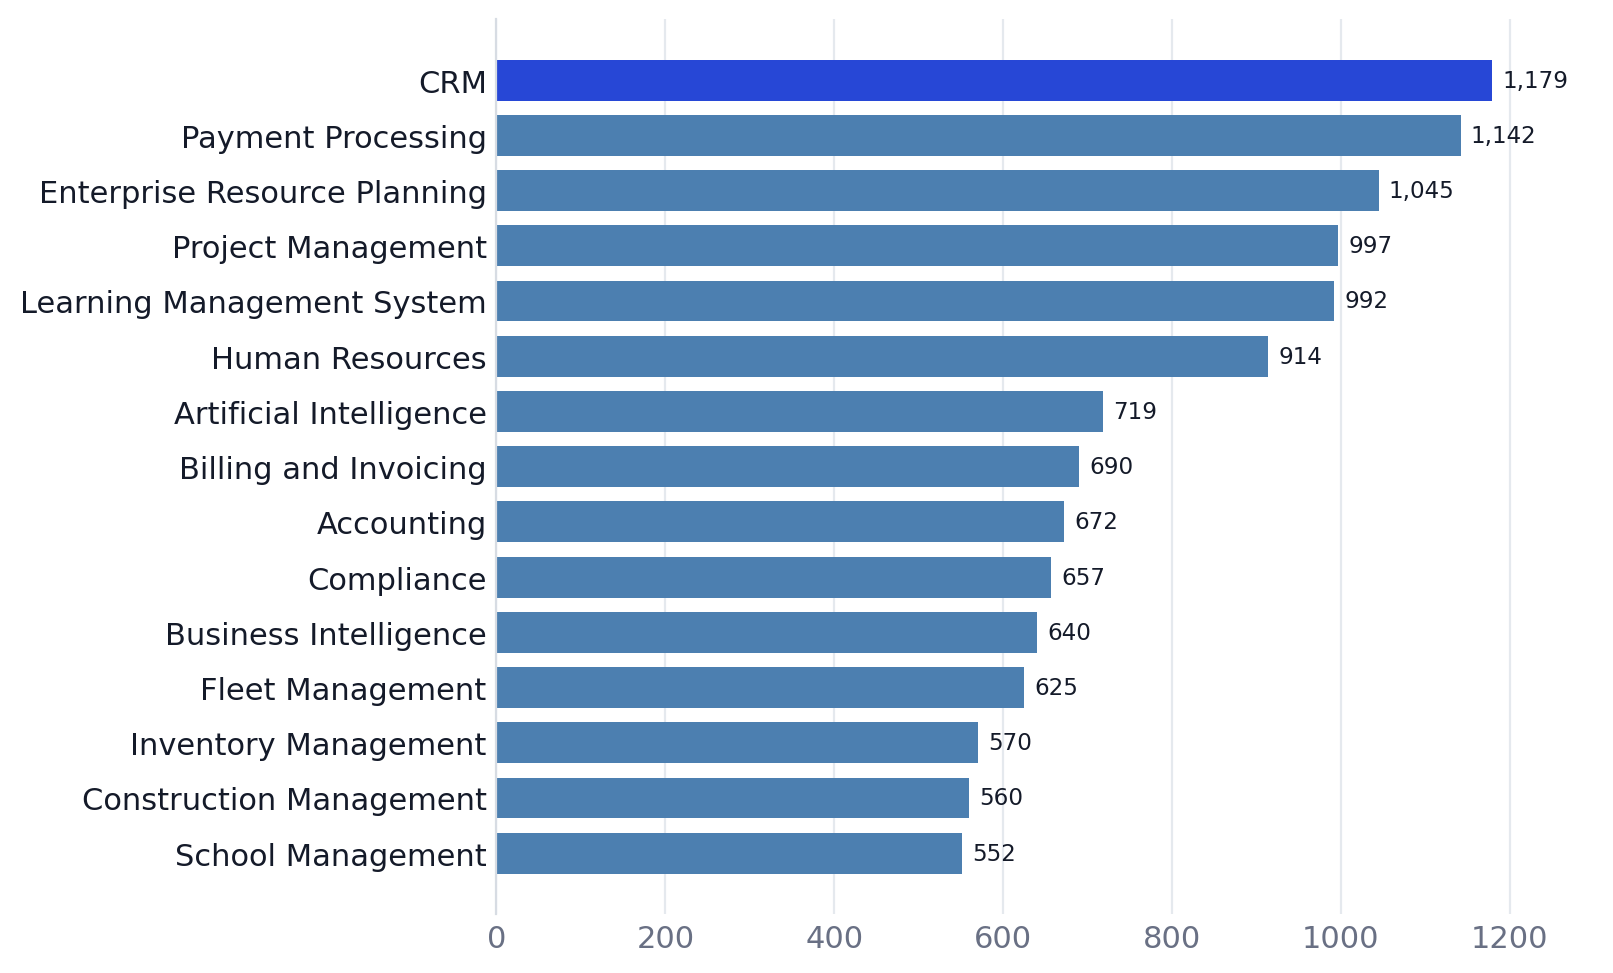
CRM leads the reported category ranking with 1,179 listings, followed by Payment Processing and Enterprise Resource Planning. Category counts do not indicate status-specific pricing or product survival.
Only 187 products separate the largest category, CRM, from the fifth-largest, Learning Management System. No single category dominates this top-five ranking. The source also reports 1,995 products without a category assignment, approximately 2.0% of the 101,781 listings. These are not represented in the named category ranking. Importantly, the report does not cross-tabulate lifecycle status or average price by software category. It would therefore be unsupported to conclude from this table that CRM has the most Active products or that one category has a higher discontinuation rate.
What can SaaS buyers, vendors, and researchers learn?
For software buyers, a catalog status can provide an initial signal about a product listing, but it is not a substitute for verifying the vendor's current website, availability, support arrangements, and pricing terms. For vendors, the report offers a snapshot of how listings are classified and how recorded price averages differ between those classifications. It does not show which pricing strategy leads to a longer product lifecycle. For market researchers, the largest limitation is the absence of time-based tracking. A status distribution observed once cannot reveal the number of products that entered Development, became Active, were sold, or were discontinued during any particular year. The analysis is therefore most useful as a descriptive catalog benchmark, not a measure of market churn or SaaS business performance.
Methodology and data limitations
This analysis uses Solevant's SaaS Software Status and Pricing report, including its status summary, category rankings and four charts. Underlying product records were not independently recalculated. Dataset: 101,781 software product listings across five recorded status labels. Price coverage: Average monthly prices are calculated only for listings with a recorded price. The report does not disclose priced-product counts for each status, the distribution of prices, or whether prices are currency-normalized. Missing classifications: 9,831 listings are labeled UNKNOWN for status, and 1,995 have no category assignment.
Status definitions: The source does not document the operational rules used to assign or verify the five labels. Reporting period: No collection date, reporting period, or update frequency was provided. No longitudinal or causal analysis: The report cannot measure churn, product failure rates, status transitions, or whether status explains price differences. Status shares are calculated from the recorded counts divided by the 101,781-listing total and rounded to two decimal places.
Category ranking: The report uses a corrected top-15 category list. Its vendor-detail sheet was not used to group categories because the source flags unreliable category values there.
Frequently asked questions
How many SaaS products are covered by the study?
101,781 product listings across five recorded statuses: Active, Development, Discontinued, Sold, and UNKNOWN.
What percentage of SaaS products are marked Active?
84,919 products, approximately 83.4% of the catalog, are marked Active. The product counts imply 83.43%.
Which status has the highest average SaaS price?
Development, with a reported average monthly price of $294.46, compared with $267.10 for Active products.
Which status has the lowest average price?
Discontinued, at $89.14 per month among Discontinued products that still have a price recorded.
How many SaaS products have an unknown status?
9,831 listings are labeled UNKNOWN, making this the second-largest status group.
How many products are discontinued or sold?
1,761 are marked Discontinued and 1,269 are marked Sold, totaling 3,030 listings. These statuses should not be combined into a measured failure rate.
What is the largest software category?
CRM, with 1,179 products, followed by Payment Processing (1,142) and Enterprise Resource Planning (1,045).
Does the report show that cheaper SaaS products are more likely to fail?
No. It compares recorded status groups and their priced-subset averages at one point in time. It does not track failures, changes in price, or causal relationships.
Are the price averages based on all 101,781 products?
No. Each status average includes only products with a price recorded. The source does not provide the number of priced observations in each status.
Conclusion
Solevant's SaaS Software Status and Pricing report shows a directory dominated by Active listings, with 84,919 of 101,781 products carrying that status. UNKNOWN is the second-largest group, while Development, Discontinued, and Sold account for smaller portions of the catalog. Recorded average monthly prices vary widely, from $294.46 for Development to $89.14 for Discontinued. Those differences are useful descriptive comparisons, but they apply only to priced listings and do not establish why the groups differ.
The central takeaway is that software status, price visibility, and product-category coverage are distinct catalog attributes. The report provides a useful snapshot of all three, provided the unknown classifications, incomplete price data, and missing reporting period remain clear.