
African SaaS Market by Country: Product Counts, Pricing and Integrations
The African SaaS market looks very different depending on which country you examine. Nigeria accounts for 419 products in Solevant's African SaaS catalog, while several countries have fewer than five listings. A review of 1,803 software products across 45 African countries shows significant differences in product representation, pricing visibility, and software integrations. Nigeria, South Africa, and Kenya lead by product count, but having more listed products doesn't necessarily mean having more transparent pricing or a higher number of integrations.
Key Takeaways
- Nigeria, South Africa, Kenya, Egypt, and Ghana account for 63.7% of the 1,803 products analyzed.
- Of the 45 African countries represented, 23 have no SaaS products with published prices recorded in the catalog.
- Nigeria leads by product count with 419 listings, followed by South Africa with 261 and Kenya with 214.
- Mauritius has published pricing for 26.5% of its 34 products, the highest proportion among the countries in the report's pricing comparison.
- Among the 12 countries shown in the integration comparison, Comoros records the highest average at 2.9 integrations per product.
Which African Countries Have the Most SaaS Products?
Nigeria leads the African SaaS catalog with 419 products, representing 23.2% of all listings. South Africa follows with 261 products (14.5%), while Kenya ranks third with 214 (11.9%). Together with Egypt and Ghana, these five countries account for 1,148 products, nearly two-thirds of the African catalog. The concentration becomes even more noticeable when the ten largest country catalogs are considered. They account for 78.4% of all products, leaving the remaining 35 countries with just 21.6%.
Table: Top 10 African Countries by SaaS Product Count
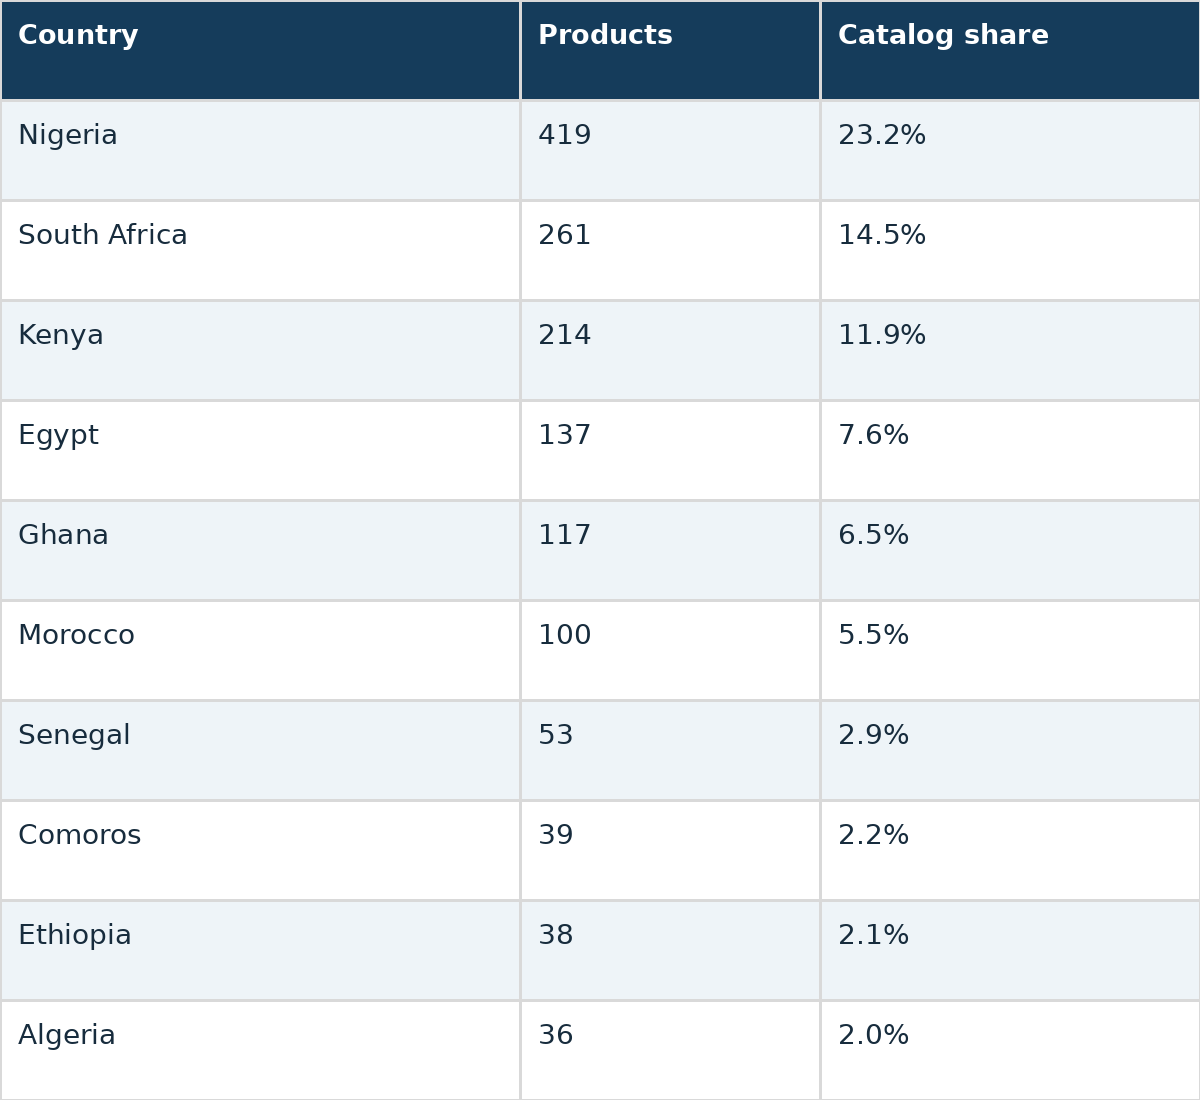
The differences extend beyond the ten largest catalogs. Another 30 countries collectively account for only 261 products, with 19 of them recording fewer than ten listings each. This concentration is important when interpreting African SaaS statistics. A continental average can conceal substantial differences between countries with hundreds of recorded products and those with only a handful. However, the figures reflect Solevant's catalog coverage, not independently measured national market sizes or SaaS revenue.
How Transparent Is SaaS Pricing Across African Countries?
Published pricing is relatively uncommon among the products included in the African catalog. Of the 45 countries analyzed, 23 have no products with publicly listed prices recorded in the source report. These include Senegal, Algeria, Rwanda, and Angola. Even among countries with published pricing information, the proportion of products displaying prices is generally small.
Table: SaaS Pricing Visibility in Selected African Countries
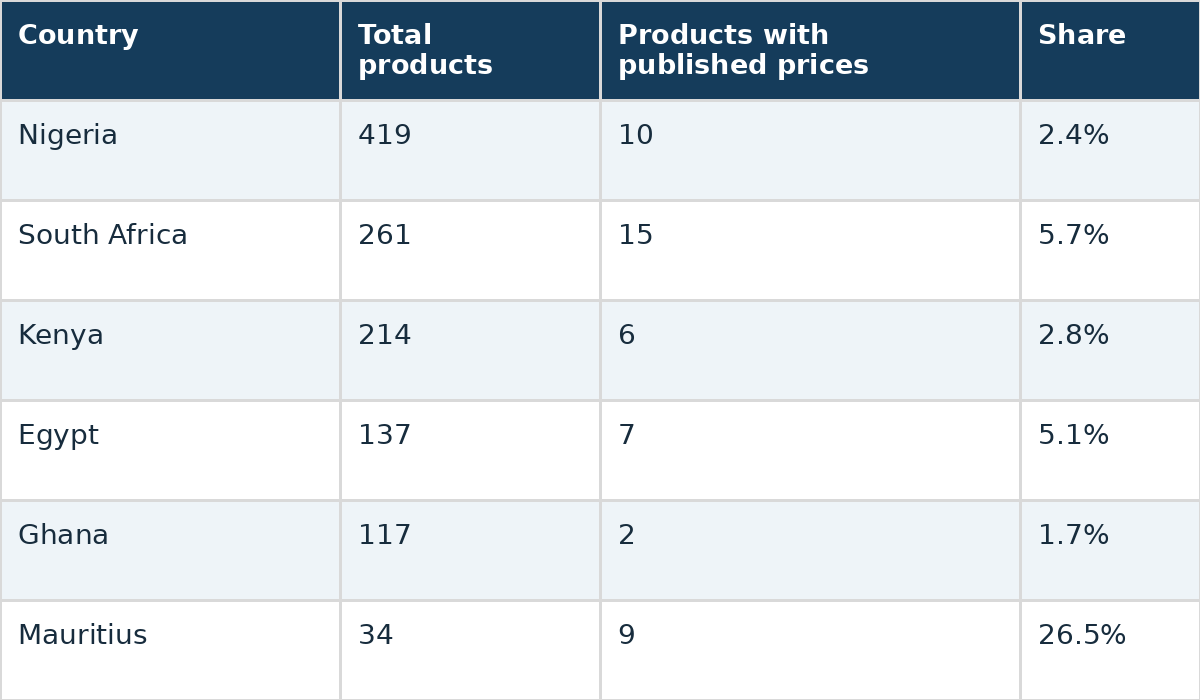
South Africa has the largest number of products with published prices among the countries in the source comparison, although those 15 products represent only 5.7% of its catalog. Mauritius presents an interesting contrast. Despite having just 34 products, nine have published prices, giving it a visibility rate of 26.5%.
The report also identifies quote-required pricing as a prominent category. In Nigeria, for example, 227 products carry a quote-required designation, compared with just ten products with published prices. For buyers comparing software options, the absence of listed prices limits how much cost information can be gathered directly from catalog entries. However, missing prices do not necessarily mean vendors refuse to disclose costs publicly. Some entries may simply lack complete pricing information.
How Do SaaS Integrations Compare Across African Countries?
Software integrations allow products to connect with other applications, including payment platforms, accounting systems, customer relationship management tools, and other business services. The source report compares average recorded integrations across 12 selected African countries with at least 15 products each.
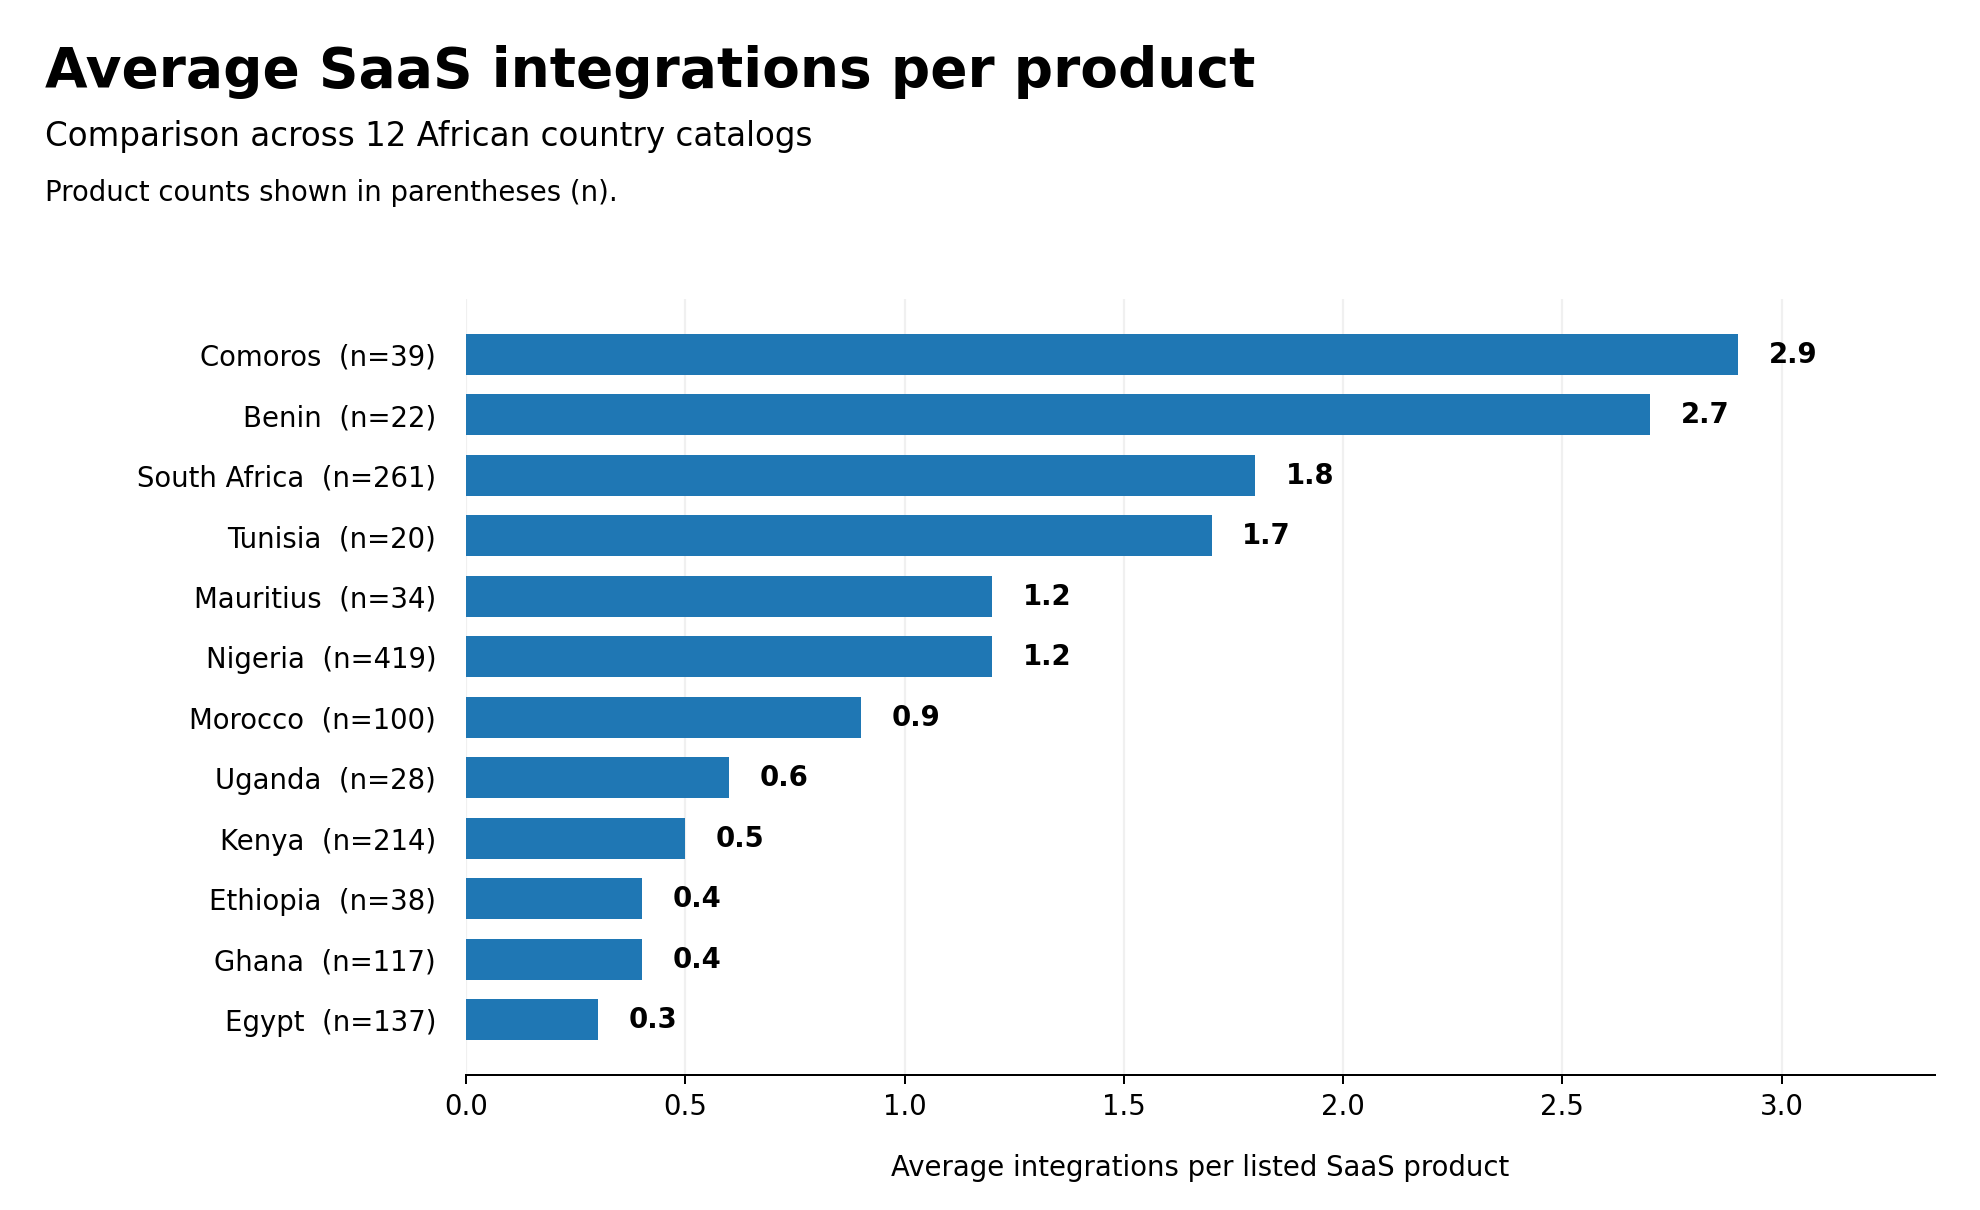
Comoros records the highest average in this comparison, at 2.9 integrations per product, followed by Benin at 2.7 and South Africa at 1.8. Nigeria averages 1.2 integrations across its 419 products. Kenya records 0.5 integrations per product, while Egypt has the lowest average among the countries shown, at 0.3. These differences show that a larger product catalog does not automatically correspond to a higher average number of recorded integrations.
Comoros, for example, has only 39 products but a higher recorded integration average than Nigeria and South Africa. However, averages from smaller catalogs can be more sensitive to individual products with unusually high integration counts. Missing integration information may also affect comparisons. The figures therefore indicate differences in recorded integration availability, rather than conclusively establishing which countries have the most technically advanced SaaS ecosystems.
What Does the Data Say About Discontinued SaaS Products?
Only three of the 1,803 products in the African catalog are marked as discontinued, representing approximately 0.17% of listings. Although this appears unusually low, it should not be interpreted as evidence that African SaaS businesses have exceptionally high survival rates. A product may remain listed as active even if its vendor has stopped operating, particularly when directory records are not regularly updated. The dataset also lacks the product histories needed to calculate actual business failure or survival rates. The result is best understood as the proportion of products marked discontinued in the catalog, rather than the proportion that have genuinely ceased operating.
Methodology and Data Limitations
This analysis is based on Solevant's African SaaS Continent Report, which cites the Country sheet of Integeration_per_category.xlsx as its source. The report covers 1,803 product listings across 45 African countries. Product counts and country shares have been cross-checked against the country tables provided. Pricing visibility refers to products with published prices recorded in the source. Integration averages refer to integrations documented in the catalog, with the published integration comparison covering 12 selected countries.
The source material does not specify a data collection date or reporting period. The underlying product-level spreadsheet was not available for independent verification during preparation of this draft. Consequently, the results should be interpreted as findings from the supplied catalog analysis, not as comprehensive or current estimates of the entire African SaaS industry.
Conclusion
Solevant's African SaaS data highlights three notable differences between the countries represented: the number of listed products, the availability of published pricing, and the average number of documented software integrations. Nigeria, South Africa, and Kenya lead in product representation, while Mauritius stands out for pricing visibility among the countries compared. Smaller catalogs, including Comoros and Benin, also record comparatively high integration averages. Together, these findings offer a useful starting point for understanding how SaaS listings differ across African countries. More complete pricing information, consistent integration records, and updated country-level data would make future comparisons considerably more informative.