
Company Index Analysis: Germany, Ghana and Australia Compared
Germany, Ghana and Australia look radically different when viewed through Solevant's company index. Together, they contribute 204,625 company records to a wider directory of 1,904,137 entities. Germany accounts for almost all of the three-country total, Australia provides a substantial but smaller collection, and Ghana appears in just 70 records. The more revealing differences concern company classifications, city coverage and recorded registration dates. Germany's directory is overwhelmingly classified as GENERAL and contains an unusually concentrated December 2017 date cluster. Australia's fund share is close to the index-wide figure and its ten busiest dates are more dispersed. Ghana's tiny sample is useful mainly for identifying a serious coverage limitation.
These are index records, not national business censuses. A country with fewer entries in this database does not necessarily have fewer companies, and a date recorded in the index may not be the date on which a company was actually incorporated.
Key findings at a glance
- Germany: 177,269 records across 9,923 cities, equivalent to 9.31% of the full index.
- Australia: 27,286 records across 4,823 cities, or 1.43% of the index.
- Ghana: 70 records across 9 cities, just 0.0037% of the index; this is far too little to characterize Ghana's business sector.
- Germany's category chart totals 177,267, two fewer than its 177,269-record KPI. The difference is unresolved.
- GENERAL entities account for 95.44% of Germany's categorized records, compared with 88.77% in Australia and 98.57% in Ghana.
- FUND accounts for 10.75% of Australia's records, versus 3.99% of Germany's and 0% of Ghana's. These are classification shares, not fund-industry market shares.
- Germany's ten busiest displayed dates fall in December 2017 and total 8,869 records (5.00%); a bulk ingestion event is possible but unverified.
- Across the five countries documented in the source comparison, including the United States and Nigeria, there are 414,299 records, or 21.76% of the full index.
How many company records are listed for Germany, Australia and Ghana?
The index contains 1,904,137 company records across all countries and reports coverage of 110,290 cities. The three countries examined here account for 204,625 records, equivalent to 10.75% of that global directory.
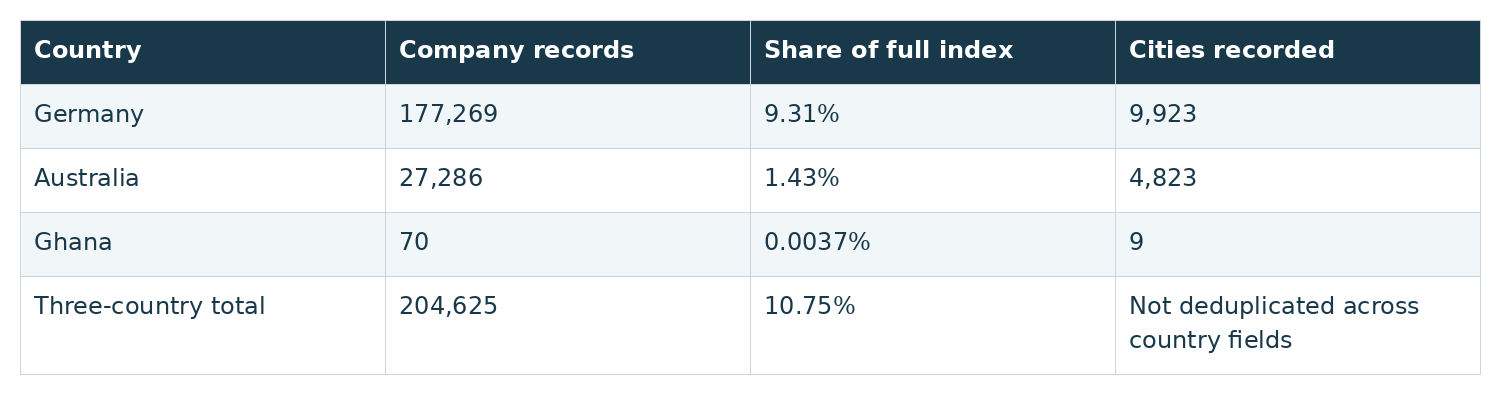
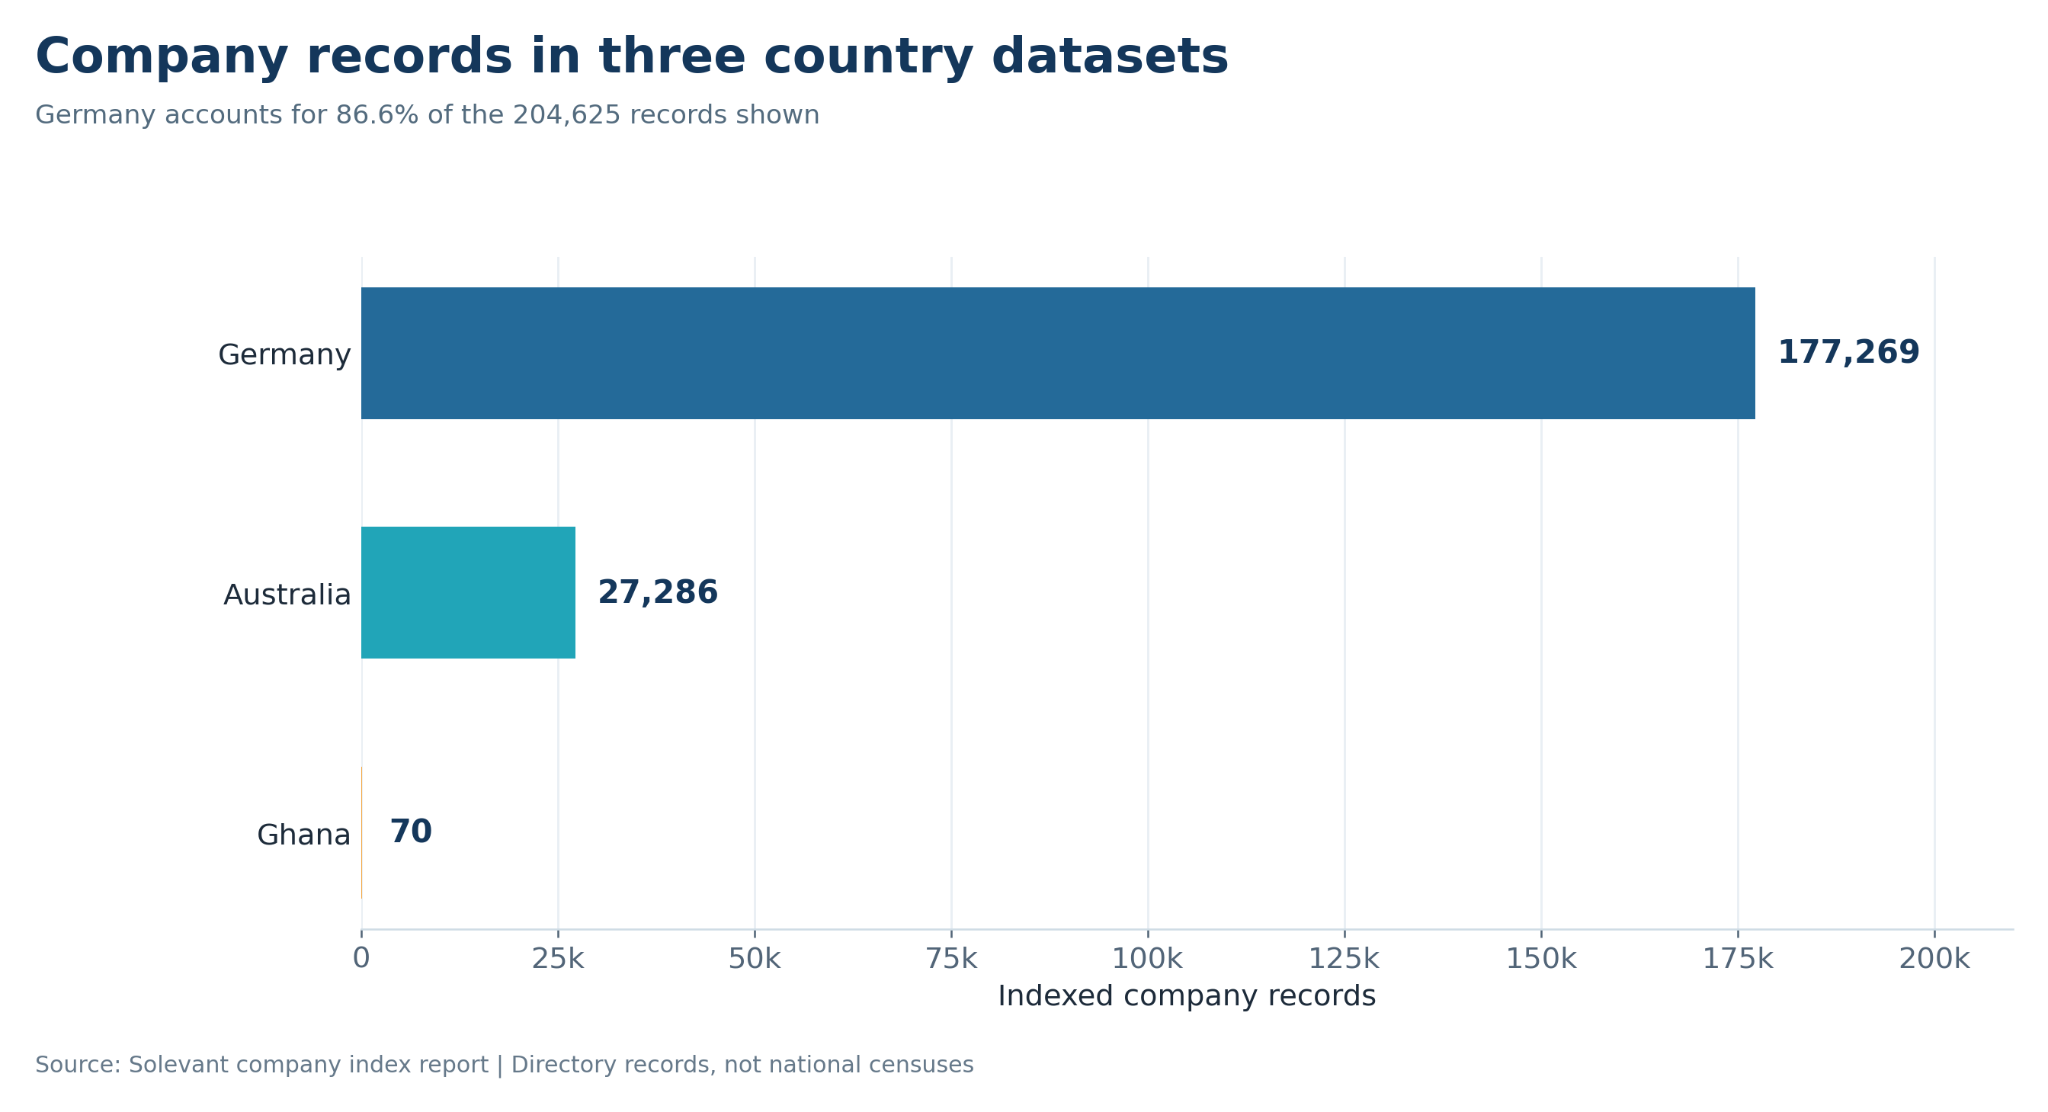
Germany contributes 86.6% of the three-country records, while Australia contributes 13.3% and Ghana approximately 0.03%. This imbalance makes the combined three-country average a poor description of any individual market. The United States has 209,194 indexed records and Nigeria has 480. The United States therefore has more records than Germany, making Germany the second-largest of these five documented country datasets.
What does city coverage reveal?
Germany's 9,923 recorded cities exceed the 8,242 listed for the United States, even though the US dataset has more companies. Australia has 4,823 recorded cities for 27,286 companies, while Nigeria has 74 and Ghana just 9.
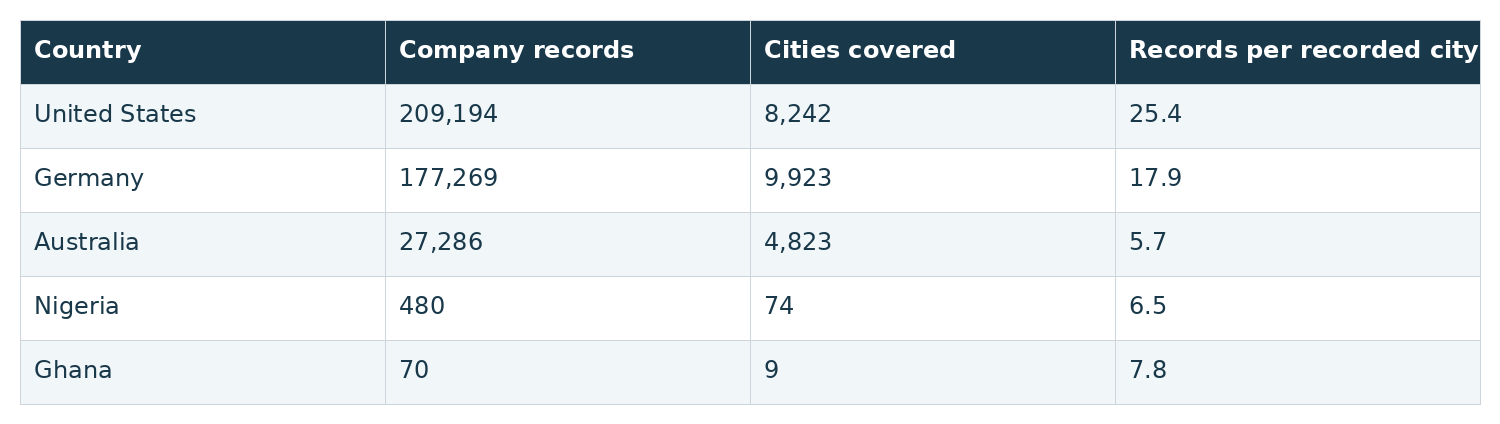
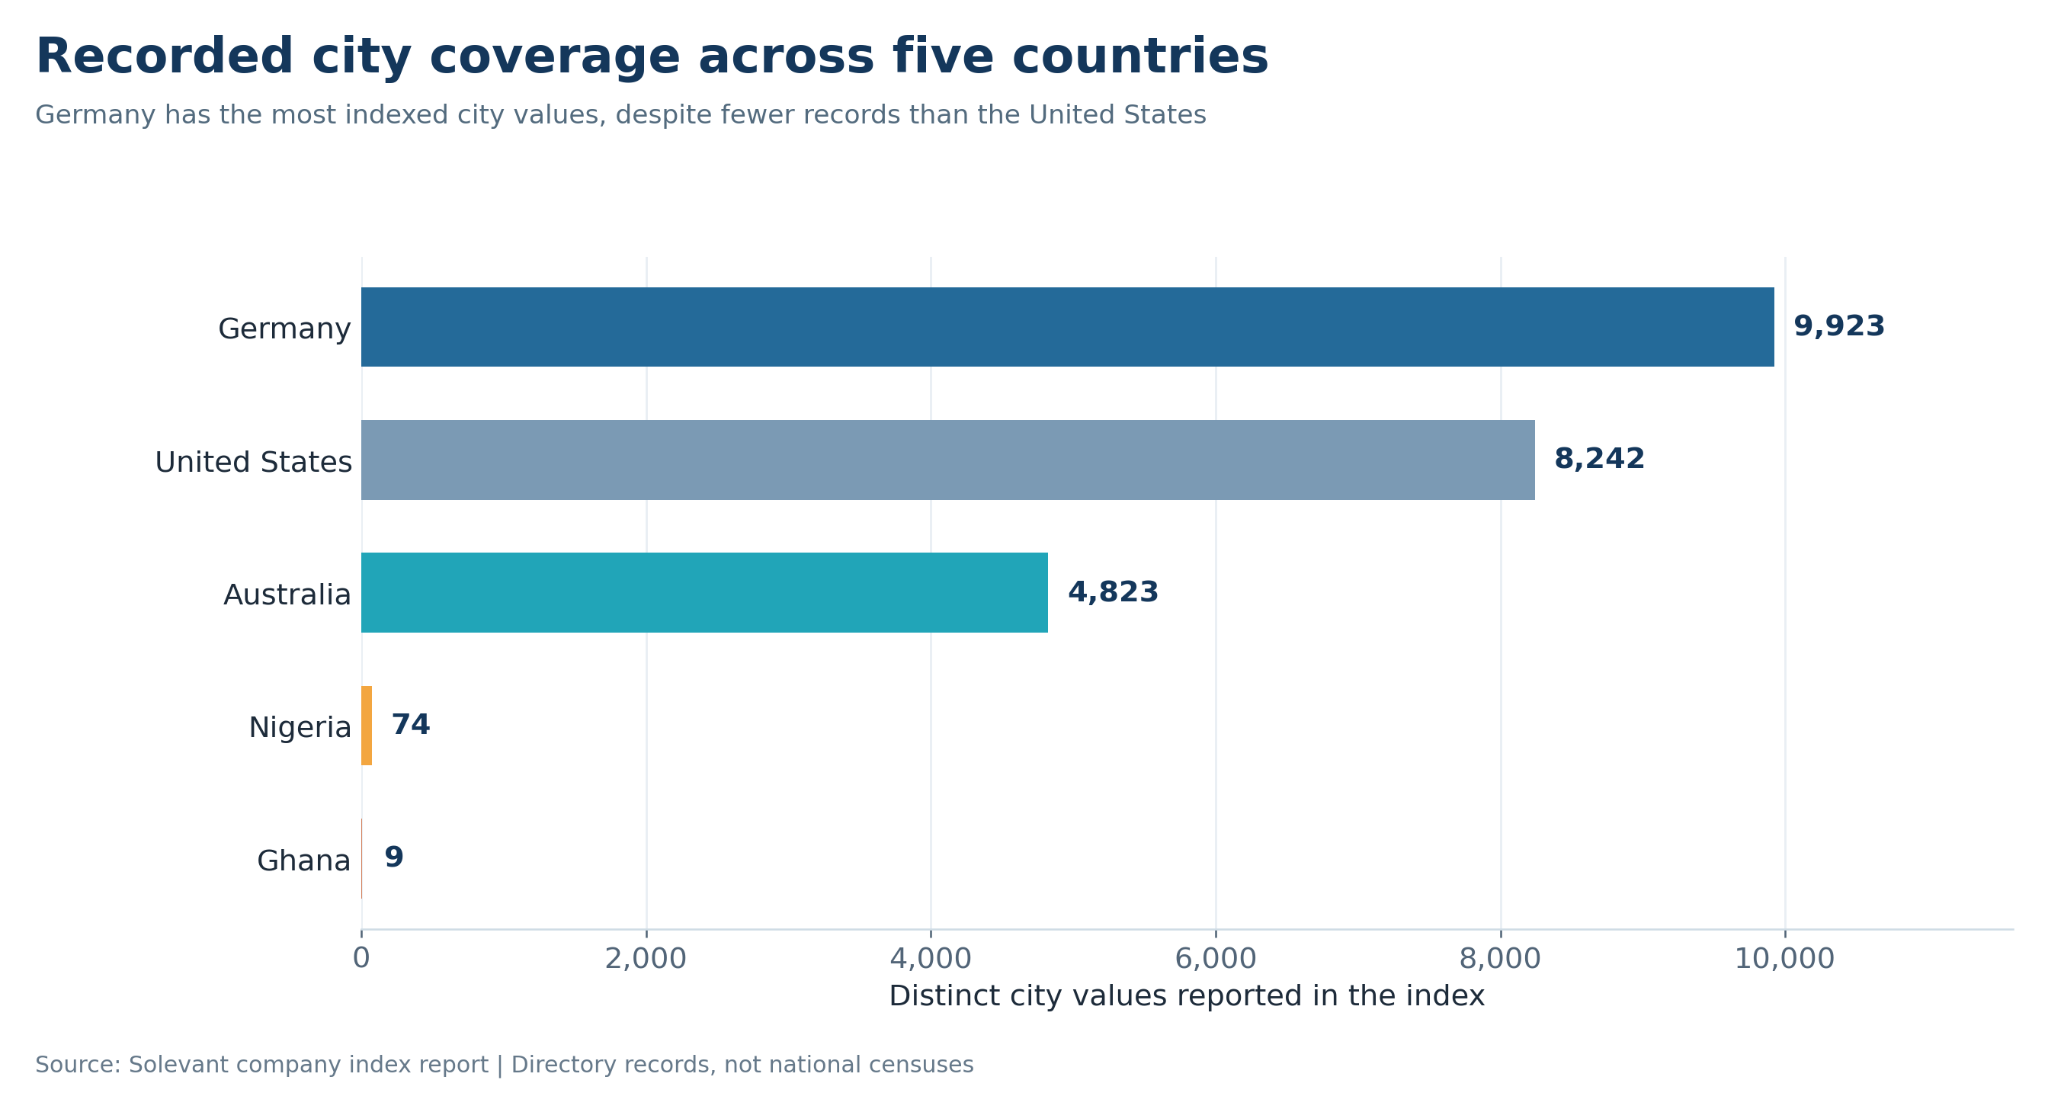
These ratios are best read as directory density per location field. They cannot establish that Australia's businesses are more geographically dispersed, or that Ghanaian companies are concentrated in only nine cities. The index may use different location sources, coverage rules or levels of geographic detail in each country.
How do GENERAL and FUND classifications differ?
The directory's GENERAL and FUND fields distinguish categories assigned by its source classification system. Across the full index, the source reports 84.92% GENERAL and 11.18% FUND. It separately reports 3.60% SOLE PROPRIETORSHIP and 0.29% Other, with a small rounding difference across the four shares. The country profiles are much less uniform:
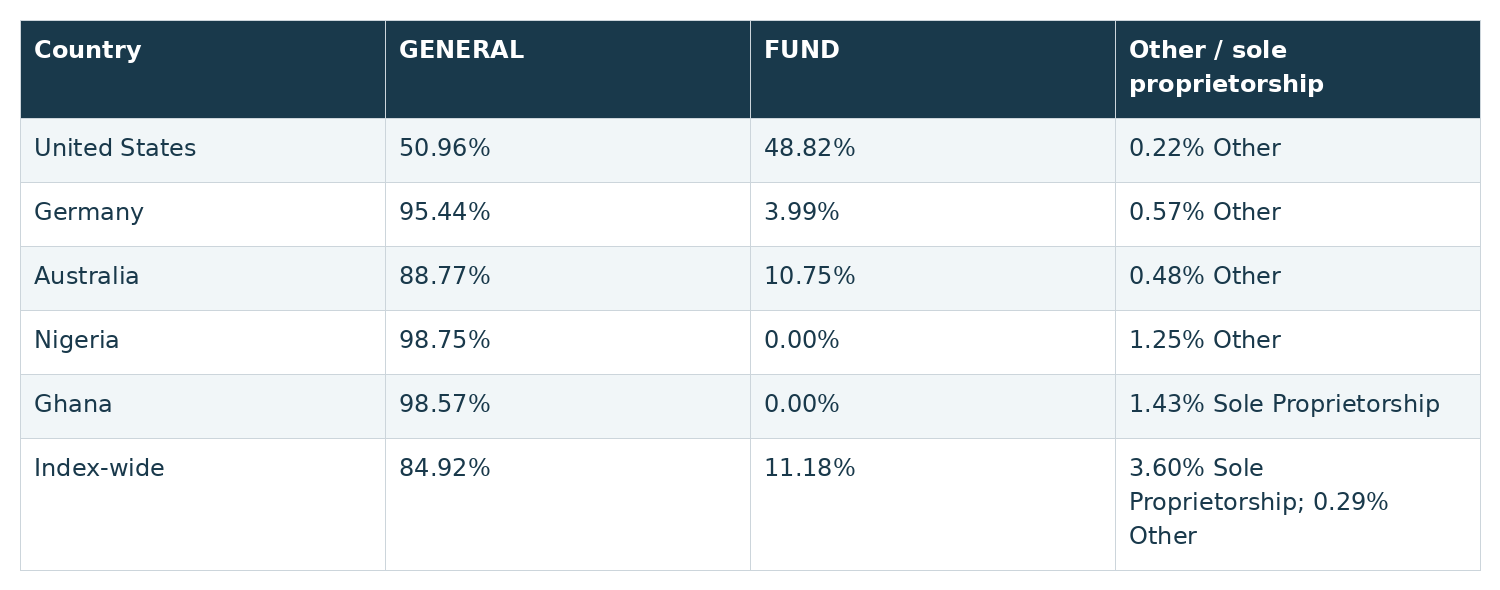
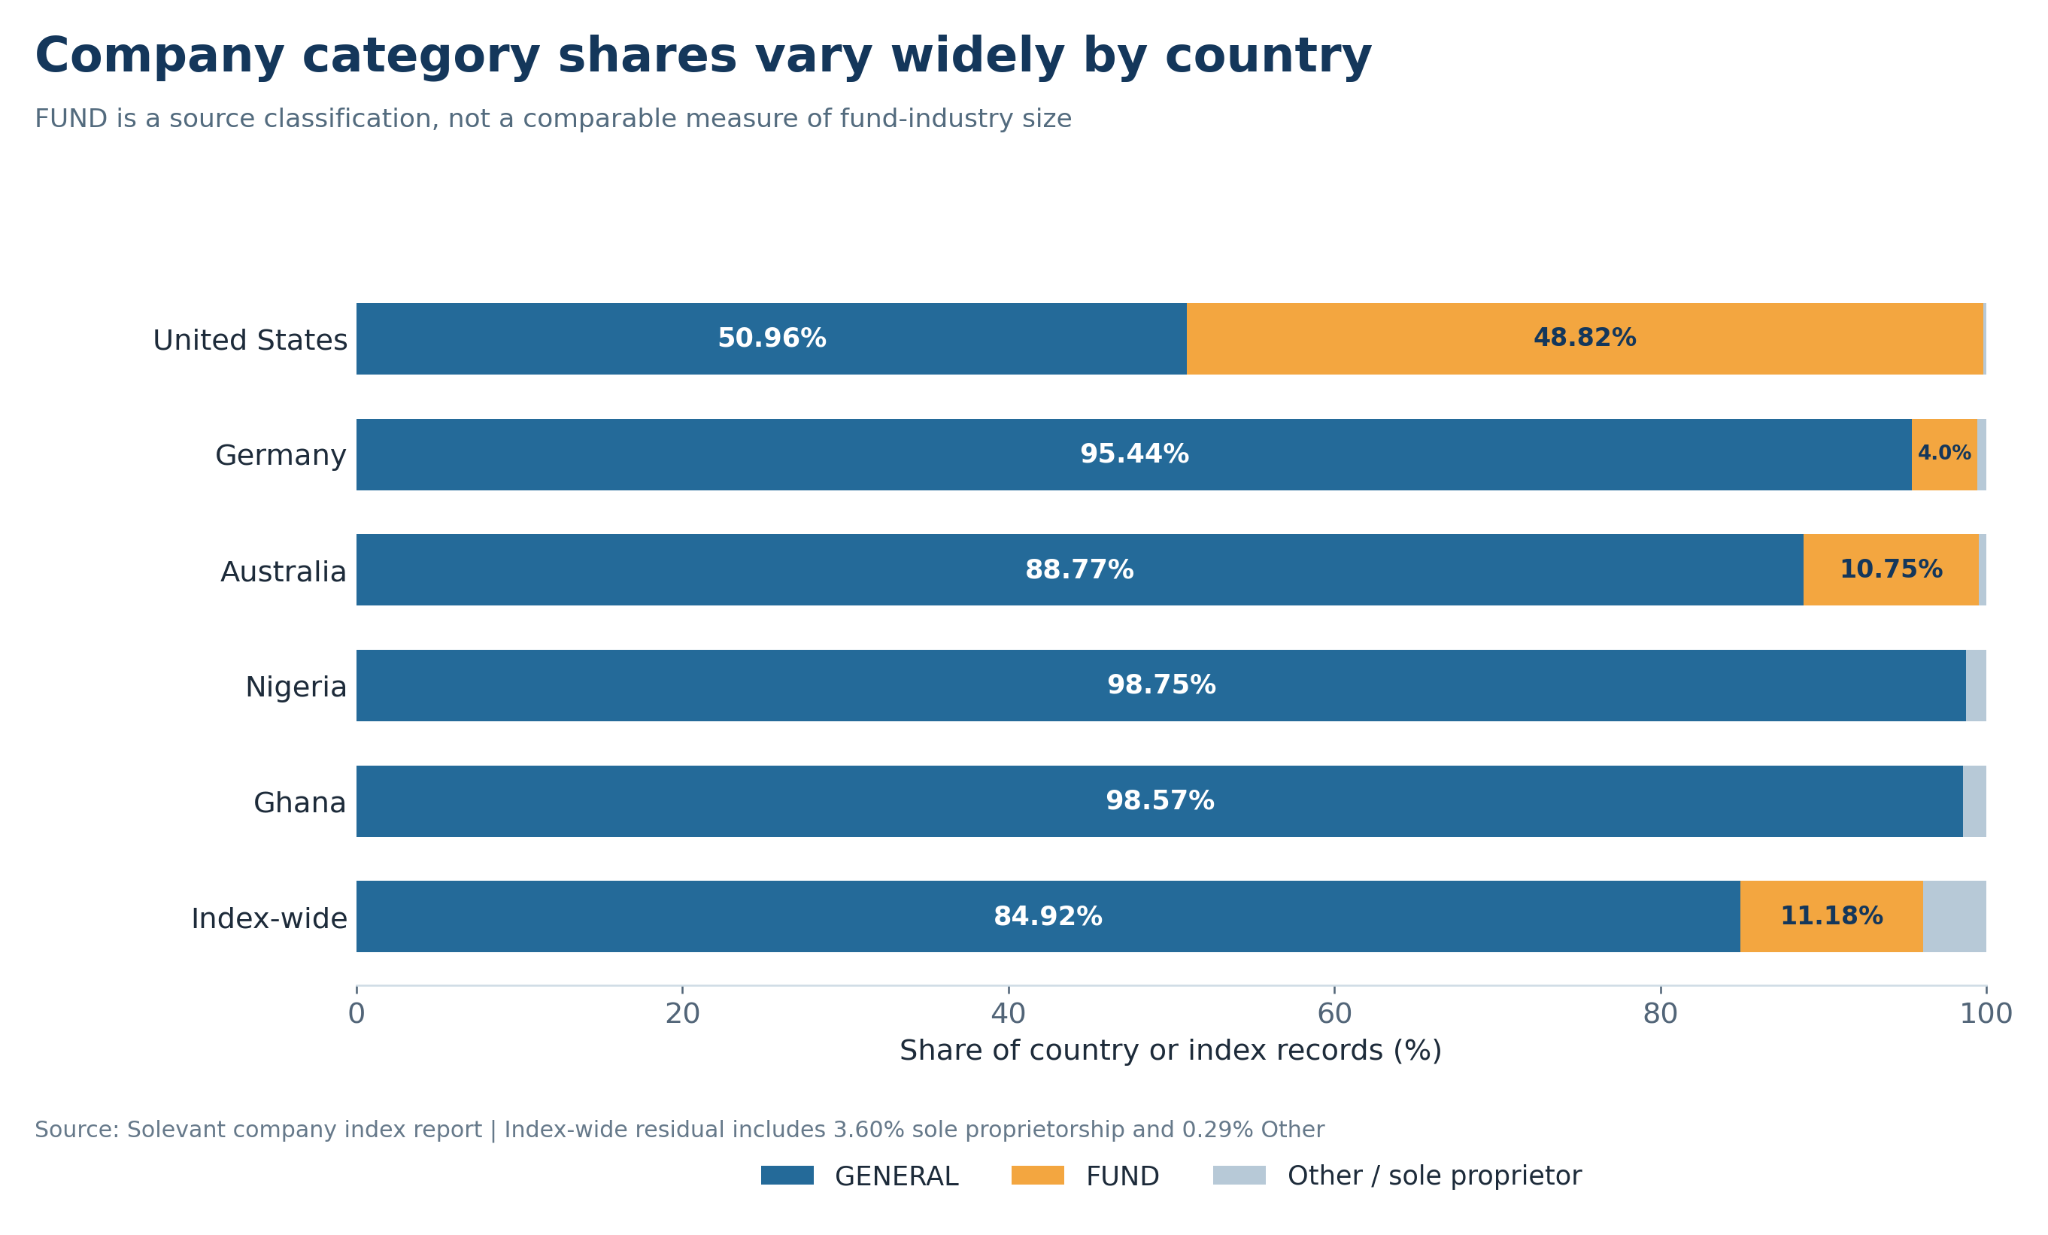
In Germany, the category chart reports 177,267 classified records, of which about 169,184 are GENERAL, 7,073 FUND and 1,010 Other. The separate KPI shows 177,269 records, leaving two records unaccounted for in the category visualization. The reason is unknown; the two should not automatically be called uncategorized without checking the underlying records. In Australia, the category total and company KPI both equal 27,286. The source estimates about 24,222 GENERAL, 2,933 FUND and 131 Other records. Because these counts are calculated from rounded percentages, they are approximate rather than exact category-level exports.
In Ghana, the numbers are small enough to be explicit: 69 GENERAL records, one SOLE PROPRIETORSHIP record and no FUND records. The absence of a FUND classification in 70 directory entries says nothing conclusive about the existence or size of Ghana's investment-fund sector.
Germany: What happened in December 2017?
The German dashboard's ten busiest registration-date entries all fall between 1 and 15 December 2017. The most prominent date is 8 December 2017, with 2,341 records—1.32% of Germany's entire indexed total.
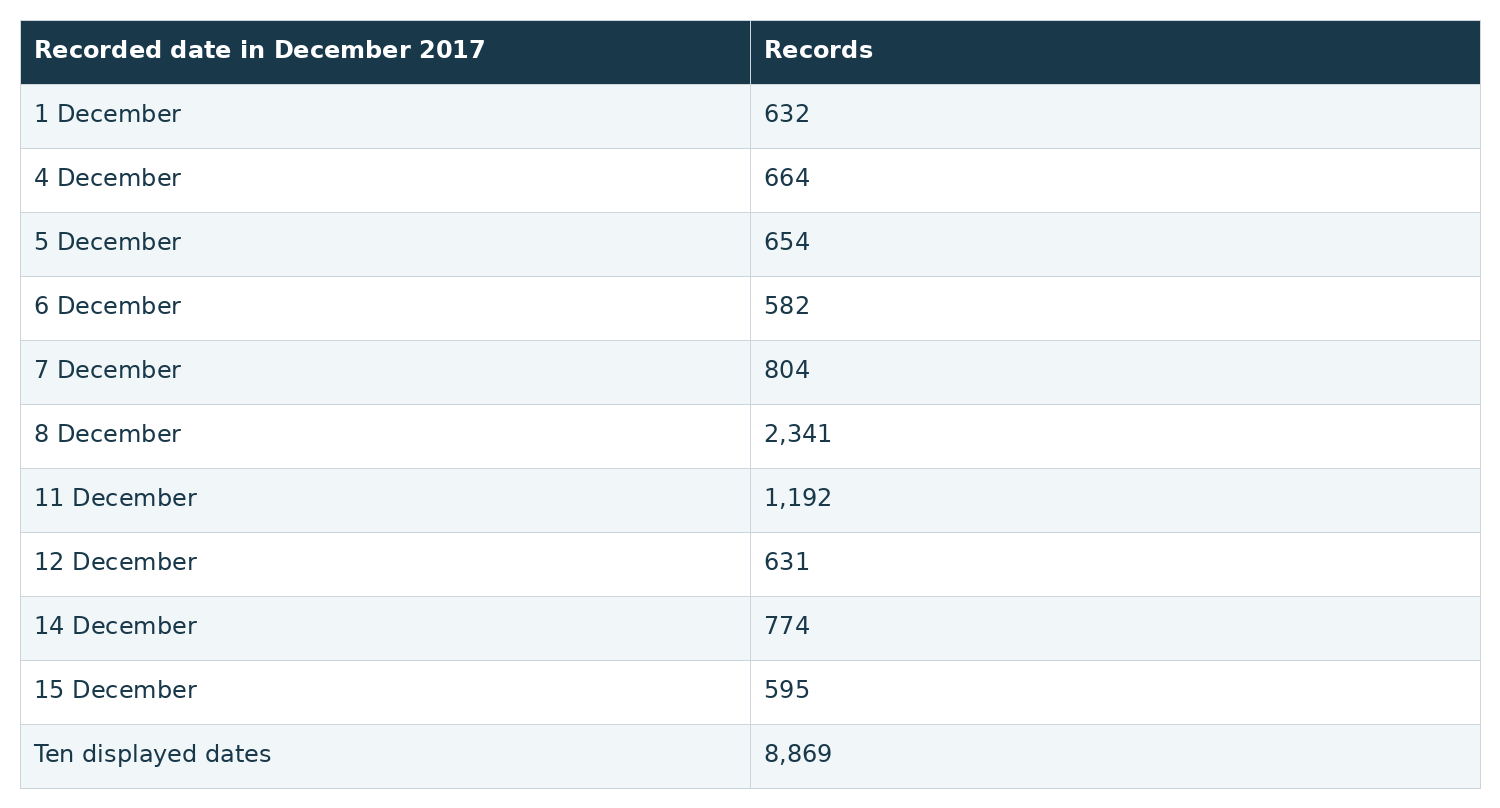
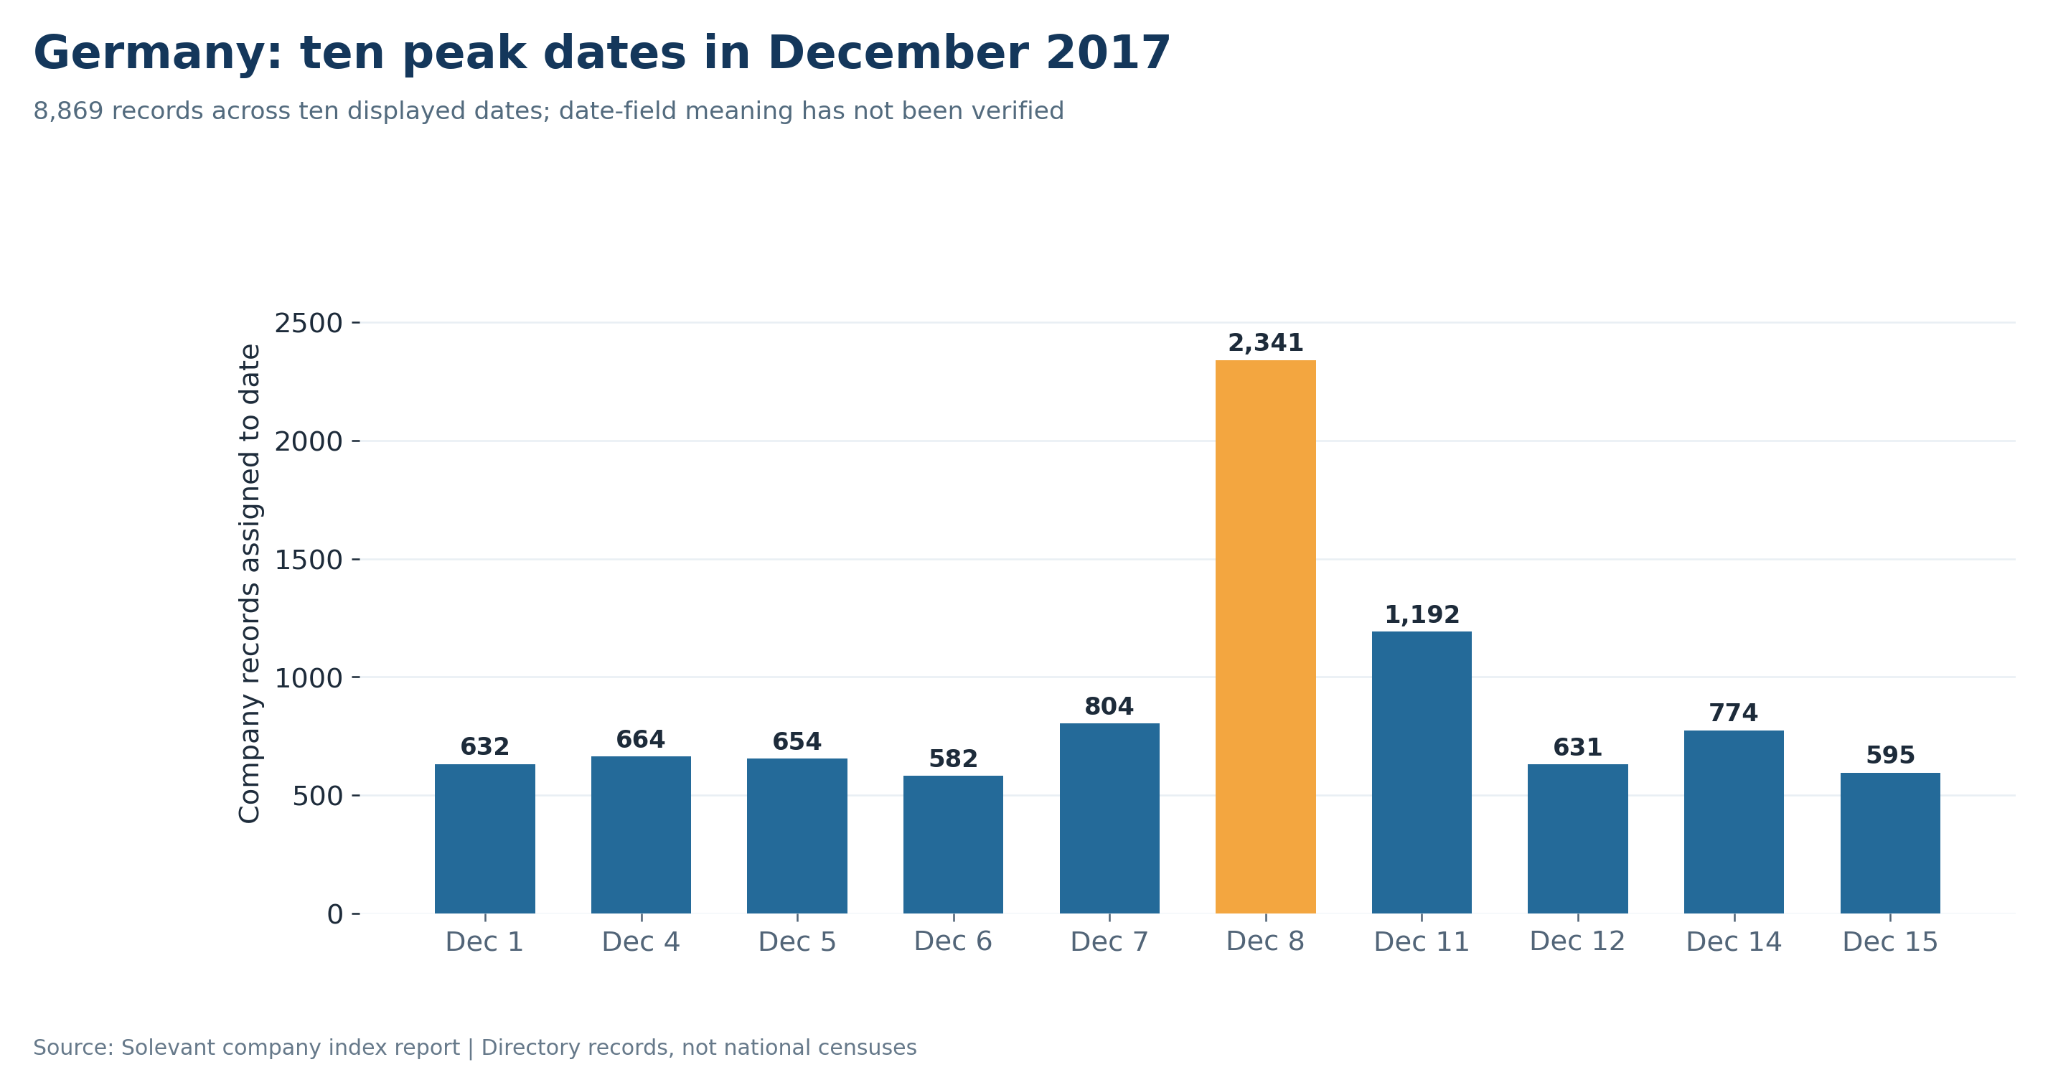
Together, these ten dates account for 8,869 records, exactly 5.00% of the German KPI total when rounded to two decimal places. All ten listed dates are weekdays within an eleven-business-day window. The source proposes that this pattern could reflect a bulk registry import or index ingestion event, rather than an extraordinary wave of newly incorporated businesses. That is a reasonable data-quality hypothesis, but the report supplies no source-system logs or field definition to confirm it. It would be misleading to publish a headline claiming that 2,341 companies were founded in Germany on 8 December 2017.
Australia: A different registration-date pattern
Australia's highest displayed date is 4 April 2019, with 204 records, approximately 0.75% of its 27,286 indexed companies. Its ten busiest displayed dates are spread across 2013, 2019, 2022 and 2024 rather than being confined to a single fortnight. The report highlights six dates in 2024 contributing 633 records. Three of those are consecutive business days in October: 16 October (133), 17 October (109) and 18 October (85), for a combined 327.
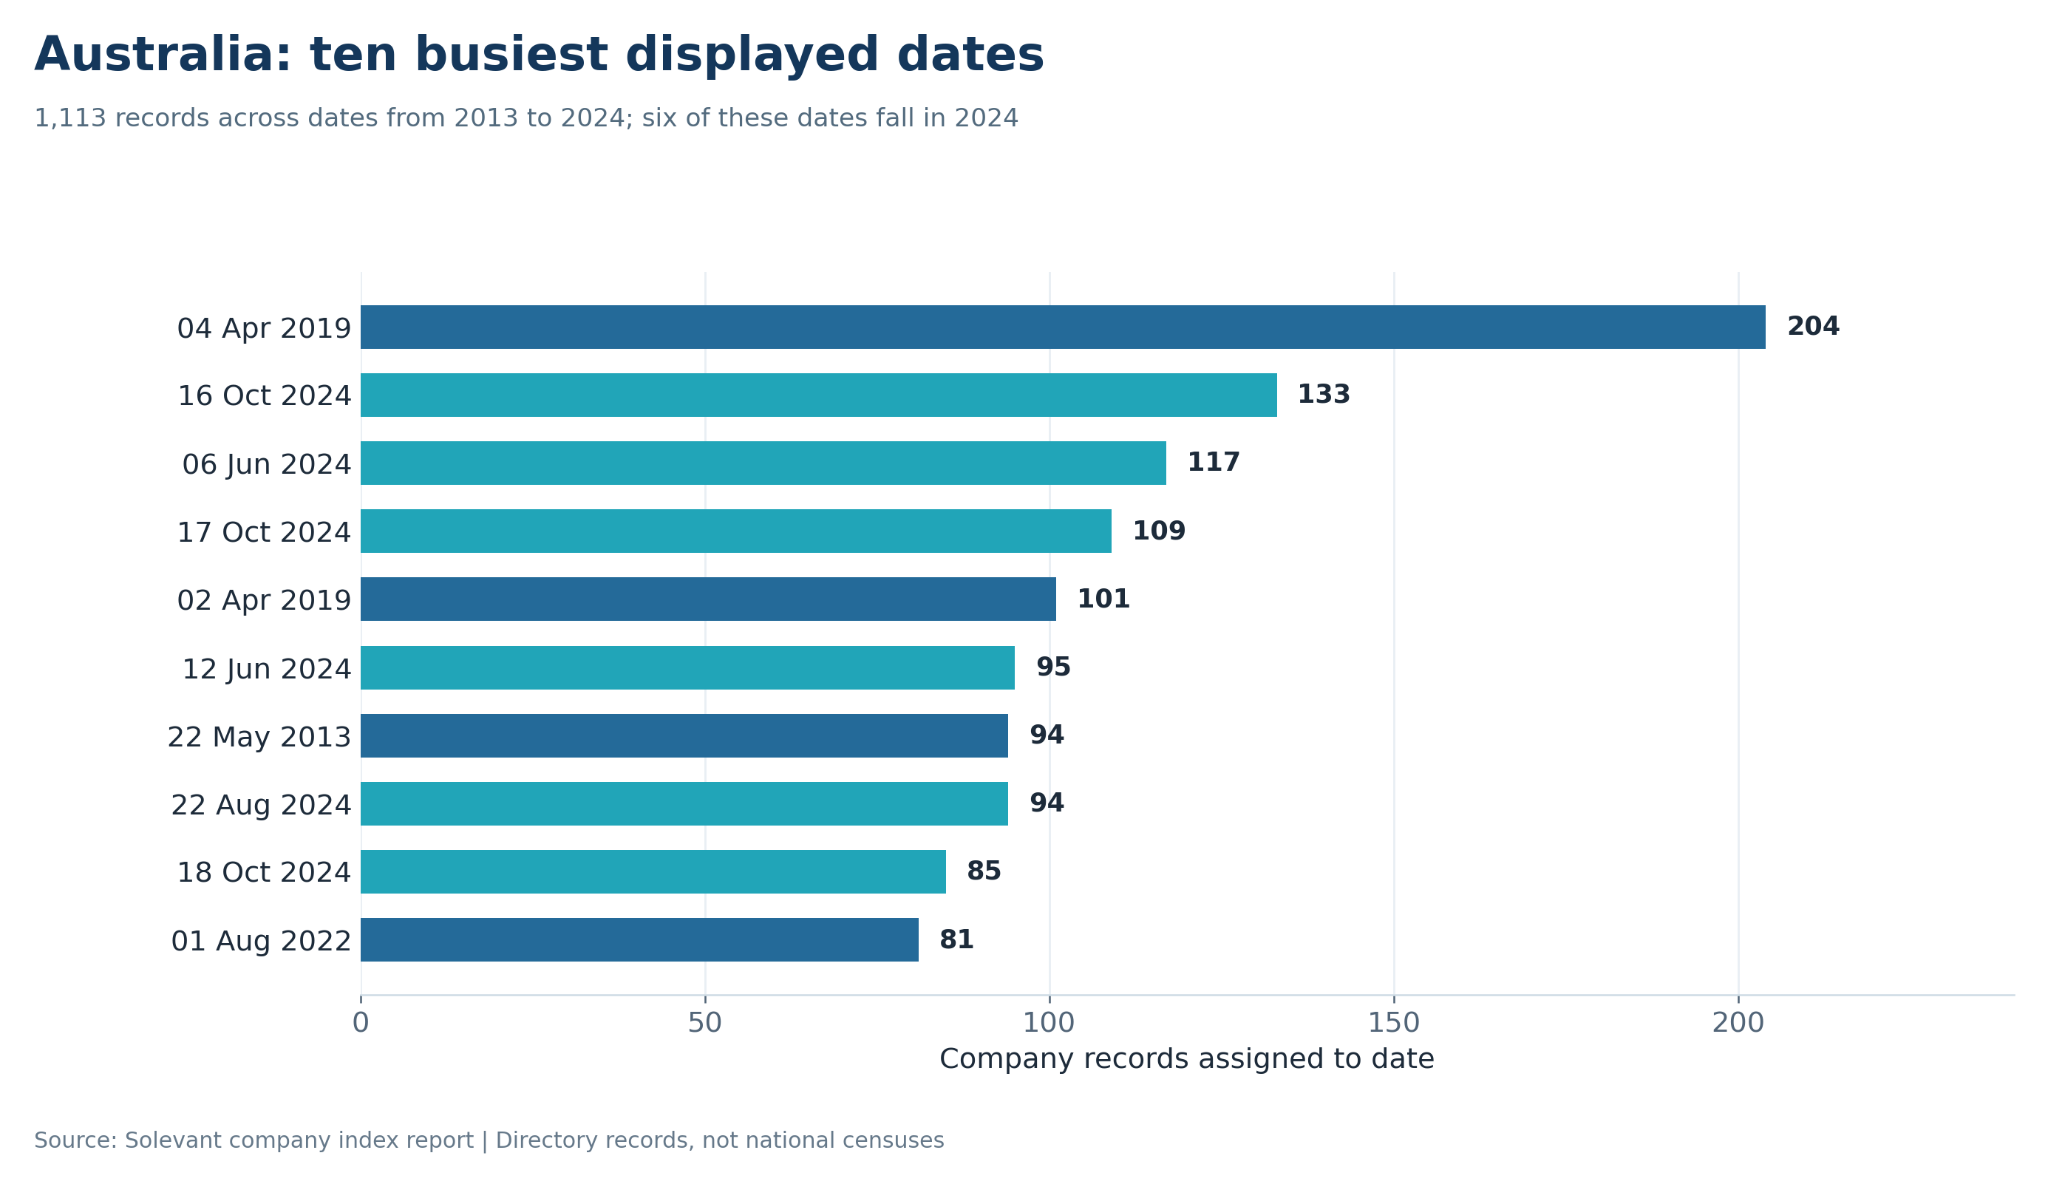
Across all ten displayed dates, the total is 1,113 records, or 4.08% of Australia's index entries. The source describes this as a more dispersed pattern than Germany's, which the listed dates support. It also suggests the timeline may be closer to actual registration activity, but that interpretation remains unverified without the source field definition. Australia's 10.75% FUND share is close to the 11.18% index-wide figure and well above Germany's 3.99%. That makes the Australian directory a useful candidate for more detailed FUND-classified record analysis. It does not prove that Australia has the largest fund industry outside the United States, since the report only compares a limited set of countries.
Ghana: What can 70 company records tell us?
Ghana has 70 entries across nine recorded cities, with 69 GENERAL entities and one SOLE PROPRIETORSHIP. Its ten busiest displayed dates account for just 14 records: four dates have two records each, and six have one each. The four dates with two records are 1 May 2020, 5 April 2021, 12 June 2025 and 2 September 2025. The six single-record dates range from 19 November 2013 to 17 August 2015.
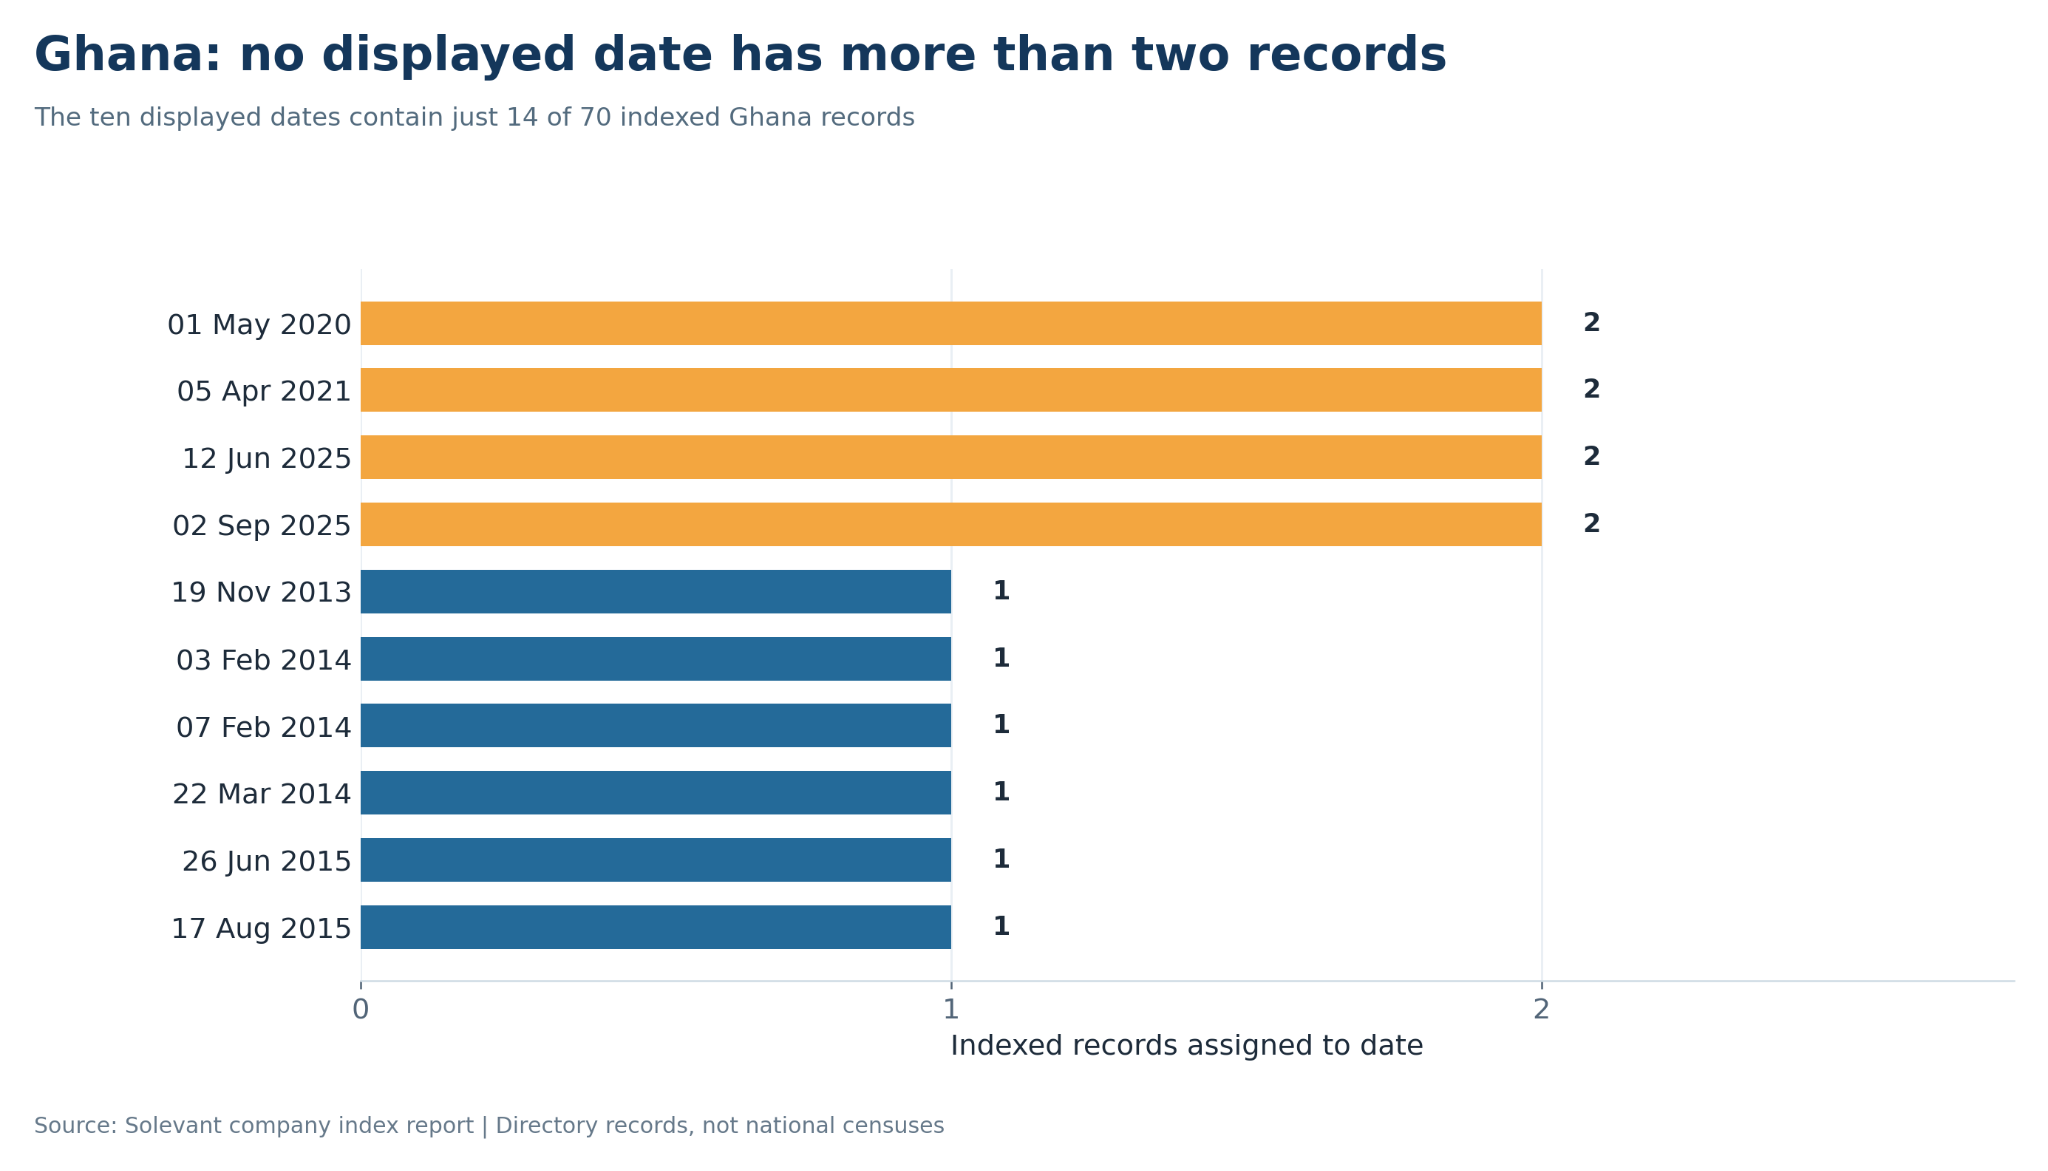
The latest date shown is 2 September 2025, but that does not establish how current or complete the full Ghanaian index is. A dataset of 70 entries cannot support claims about Ghana's national company population, the proportion of sole proprietors, the prevalence of funds or long-term incorporation trends. The useful conclusion is about data coverage: the source identifies Ghana as a priority for additional official registry ingestion and verification. A larger and more representative dataset would be required before country-level business-sector conclusions are appropriate.
Do the busiest dates represent the same level of concentration?
The ten busiest displayed dates cover 5.00% of Germany's company records, 4.08% of Australia's and 20.0% of Ghana's. Ghana's percentage is higher because the entire country sample is only 70 entries; its ten dates contain just 14 records.
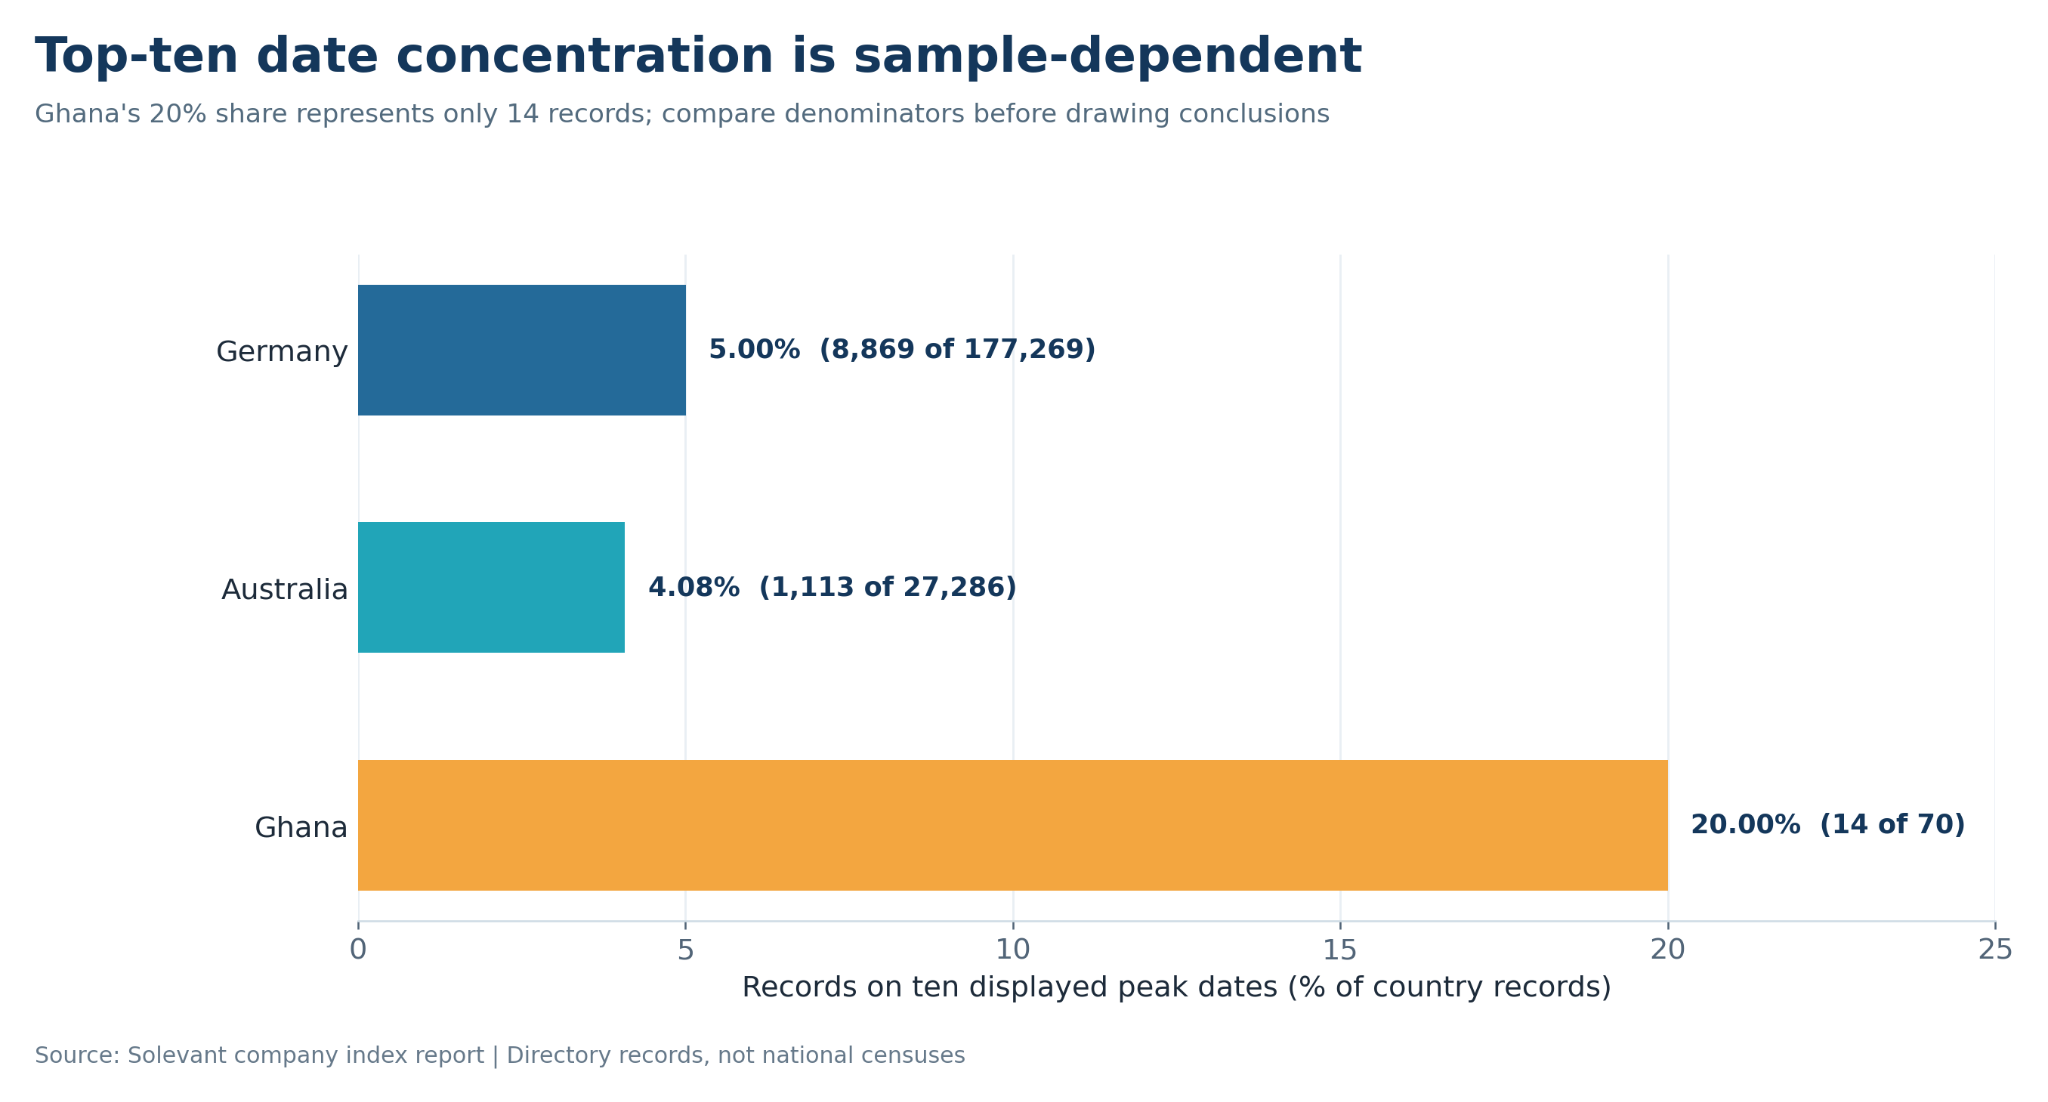
These percentages describe how the displayed date charts are distributed within each indexed sample. They do not provide comparable national company formation rates, especially when record ingestion practices and date-field definitions are unknown.
What does the five-country comparison add?
With the United States and Nigeria included, the five documented country datasets contain 414,299 company records, or 21.76% of the 1,904,137-record index. The United States and Germany alone account for 386,463 records, about 20.30% of the full directory. The company-category differences are substantial: FUND is 48.82% in the US, 10.75% in Australia, 3.99% in Germany, and 0% in the small Nigerian and Ghanaian samples. The index-wide 11.18% FUND share should therefore not be treated as a universal country benchmark.
Methodology and limitations
Source and scope: Solevant, Index Data (Company): Germany, Ghana and Australia. The analysis uses dashboard counts and the cross-country comparison. No dashboard observation date or underlying record-level export is available. Directory, not census: The baseline of 1,904,137 records and 110,290 recorded cities measures the index's coverage. It is not an independently validated count of active companies or cities where businesses operate. Geographic comparisons: Company records per city are simple ratios of two dashboard metrics. City names, geocoding, duplicates and source completeness were not independently audited.
Categories: GENERAL, FUND, SOLE PROPRIETORSHIP and Other are source labels. They are not standardized measures of operating businesses, legal entities or investment-fund assets across jurisdictions. Germany's KPI and category totals differ by two records. Approximate counts derived from rounded percentages are labeled accordingly. Registration dates: The source does not establish whether the date field reflects incorporation, registration, data creation or import. The December 2017 Germany spike may be a batch event, but that remains a hypothesis. Small samples: Ghana's 70 records and Nigeria's 480 records are inadequate for broad conclusions about their national business populations. Australia and Germany also require coverage validation before being interpreted as national censuses.
Frequently asked questions
How many companies are in Germany's Solevant index?
The dashboard KPI shows 177,269 company records across 9,923 cities. Its category chart contains 177,267 records, a two-record difference that needs investigation.
How many companies are listed for Australia?
27,286 records across 4,823 cities, representing approximately 1.43% of the full index.
Why does Ghana have only 70 company records?
The supplied report does not establish the precise reason. It identifies the 70-record sample as a directory coverage gap, not a representation of Ghana's real company population.
Which country has the largest FUND share in this comparison?
The United States, at 48.82% of its indexed records. Among Germany, Australia and Ghana, Australia has the largest FUND share at 10.75%. These are directory classifications, not market-size estimates.
Were 2,341 German companies incorporated on 8 December 2017?
The index assigns 2,341 records to that date, but the source has not verified what the date field means. A bulk import is a possible explanation, so a claim about actual incorporation activity would be premature.
Does Australia have more companies per city than Germany?
Not in this dataset. Australia has approximately 5.7 records per recorded city, compared with 17.9 for Germany. These are index coverage ratios, not measures of real-world business density.
What is the combined company count for the three countries?
Germany, Ghana and Australia together have 204,625 records, approximately 10.75% of the full 1,904,137-record directory.
Conclusion
The strongest finding from Solevant's Germany, Ghana and Australia company index is not that one economy has more or fewer businesses than another. It is that the index captures three very different country datasets: a large German collection with an unexplained December 2017 date cluster, a medium-sized Australian collection with a visible FUND-classified segment, and a Ghanaian collection too small for national inference. These comparisons are useful when directory coverage is kept separate from national economic activity. Germany’s two-record category mismatch, the uncertain date-field definition and uneven country coverage limit the conclusions that can be drawn.
Source: Solevant, Index Data (Company): Germany, Ghana and Australia. Dashboard capture date not stated in the report.