
New SaaS Entrants in 2023: 355 Products Across 170 Categories
Artificial Intelligence attracted more new SaaS products in 2023 than any other software category in Solevant's dataset. Of the 355 new SaaS products recorded across 1,142 categories, 32 entered the Artificial Intelligence category. Chatbot followed with 13, while Collaboration and AI Writing Assistant each recorded 12. But the larger finding is how concentrated new product activity was. Only 170 categories recorded at least one entrant, while 972 categories saw none. The data also reveals an interesting distinction between pricing and competition: categories attracting new entrants generally had higher recorded prices, but existing category size was much more strongly correlated with the number of new products.
Key Findings
- 355 new SaaS products were recorded in 2023 across 170 of 1,142 categories.
- 972 categories (85.1%) recorded no new products.
- Artificial Intelligence led with 32 entrants, followed by Chatbot with 13.
- Five AI-focused categories accounted for 62 entrants (17.5%).
- The top ten categories accounted for 112 new products, or 31.5% of all entries.
- AI Writing Assistant had the highest relative entry rate at 13.2%, among categories with at least 20 existing products.
- Categories with new entrants had a higher median recorded average price: $111.56 versus $65.56.
- Existing category size correlated more strongly with new entrants (Pearson r = 0.453) than average price did (r = 0.066).
Which SaaS Categories Attracted the Most New Products in 2023?
Artificial Intelligence led with 32 new products, nearly three times the 13 recorded for Chatbot. Collaboration and AI Writing Assistant tied for third with 12 entrants each, followed by Human Resources with 11.
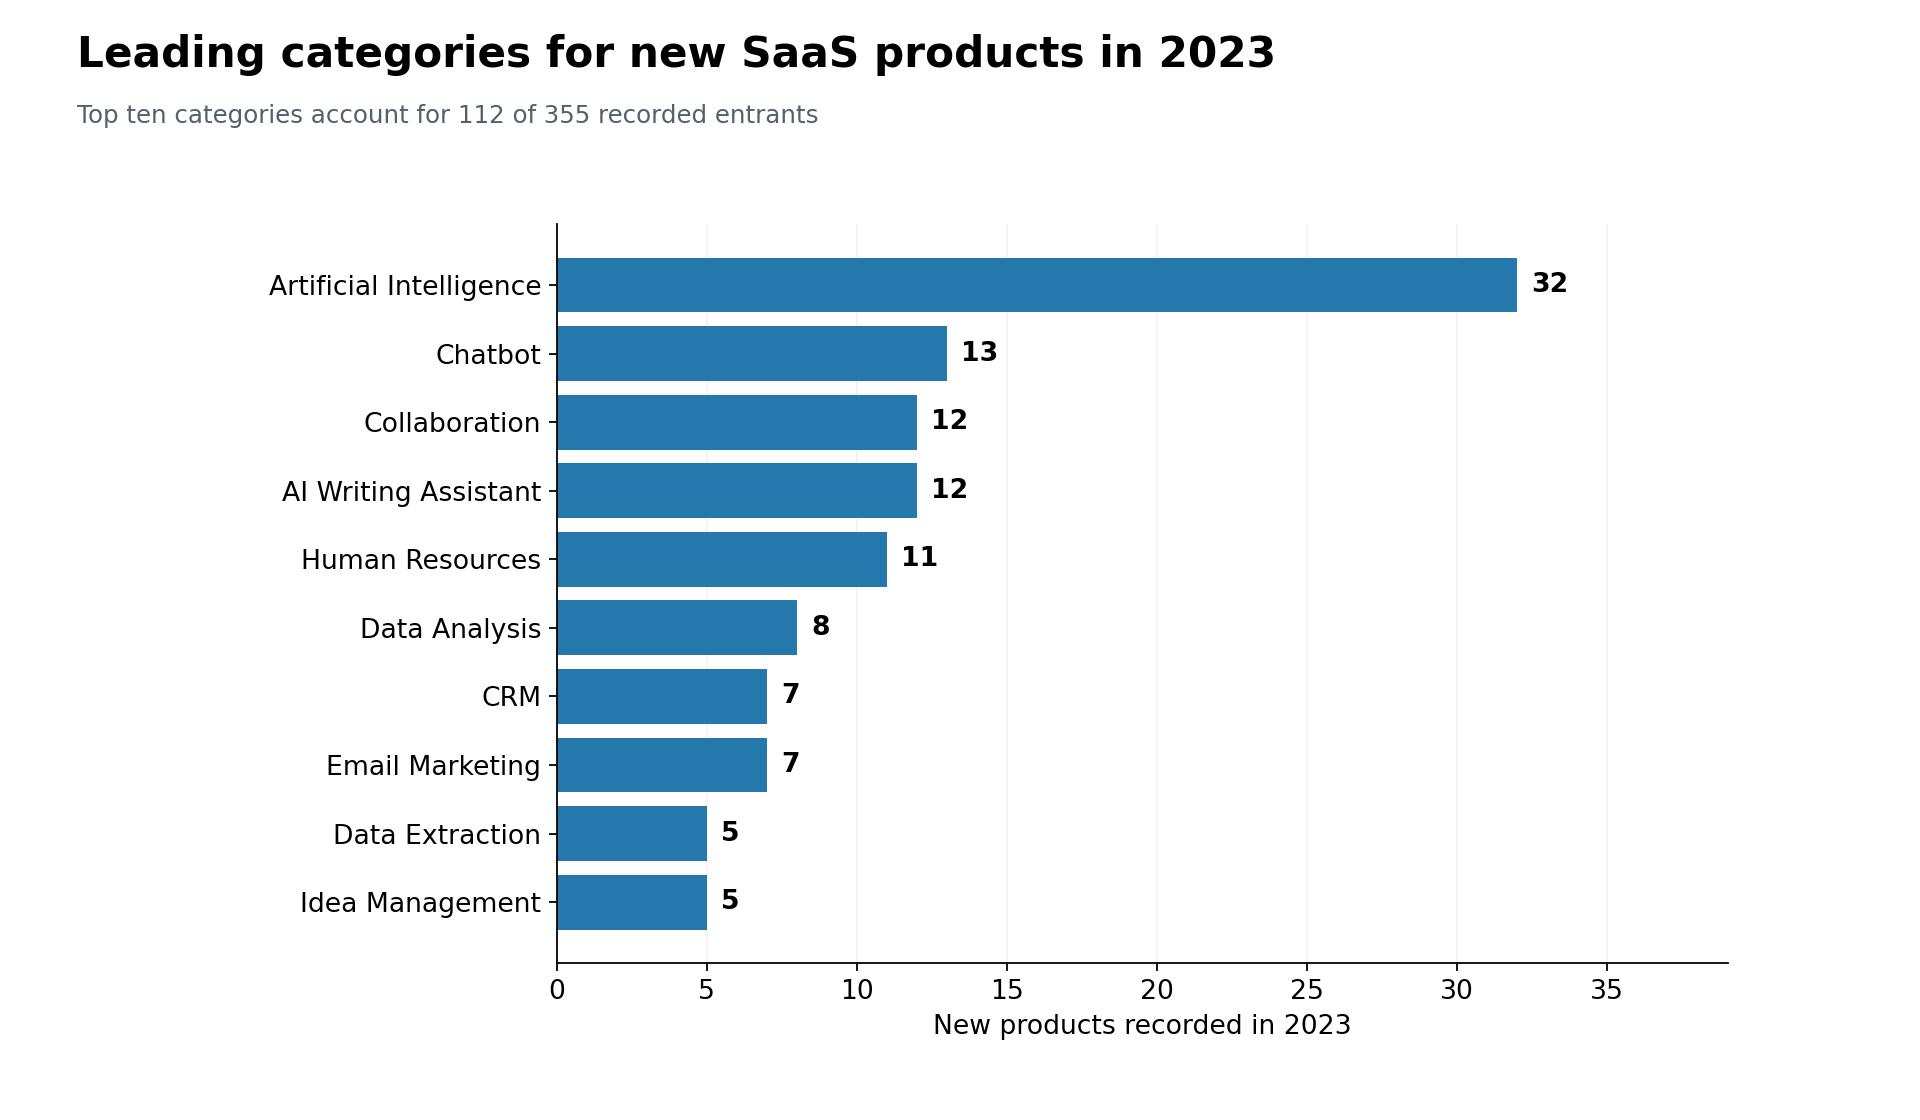
The ten leading categories were:
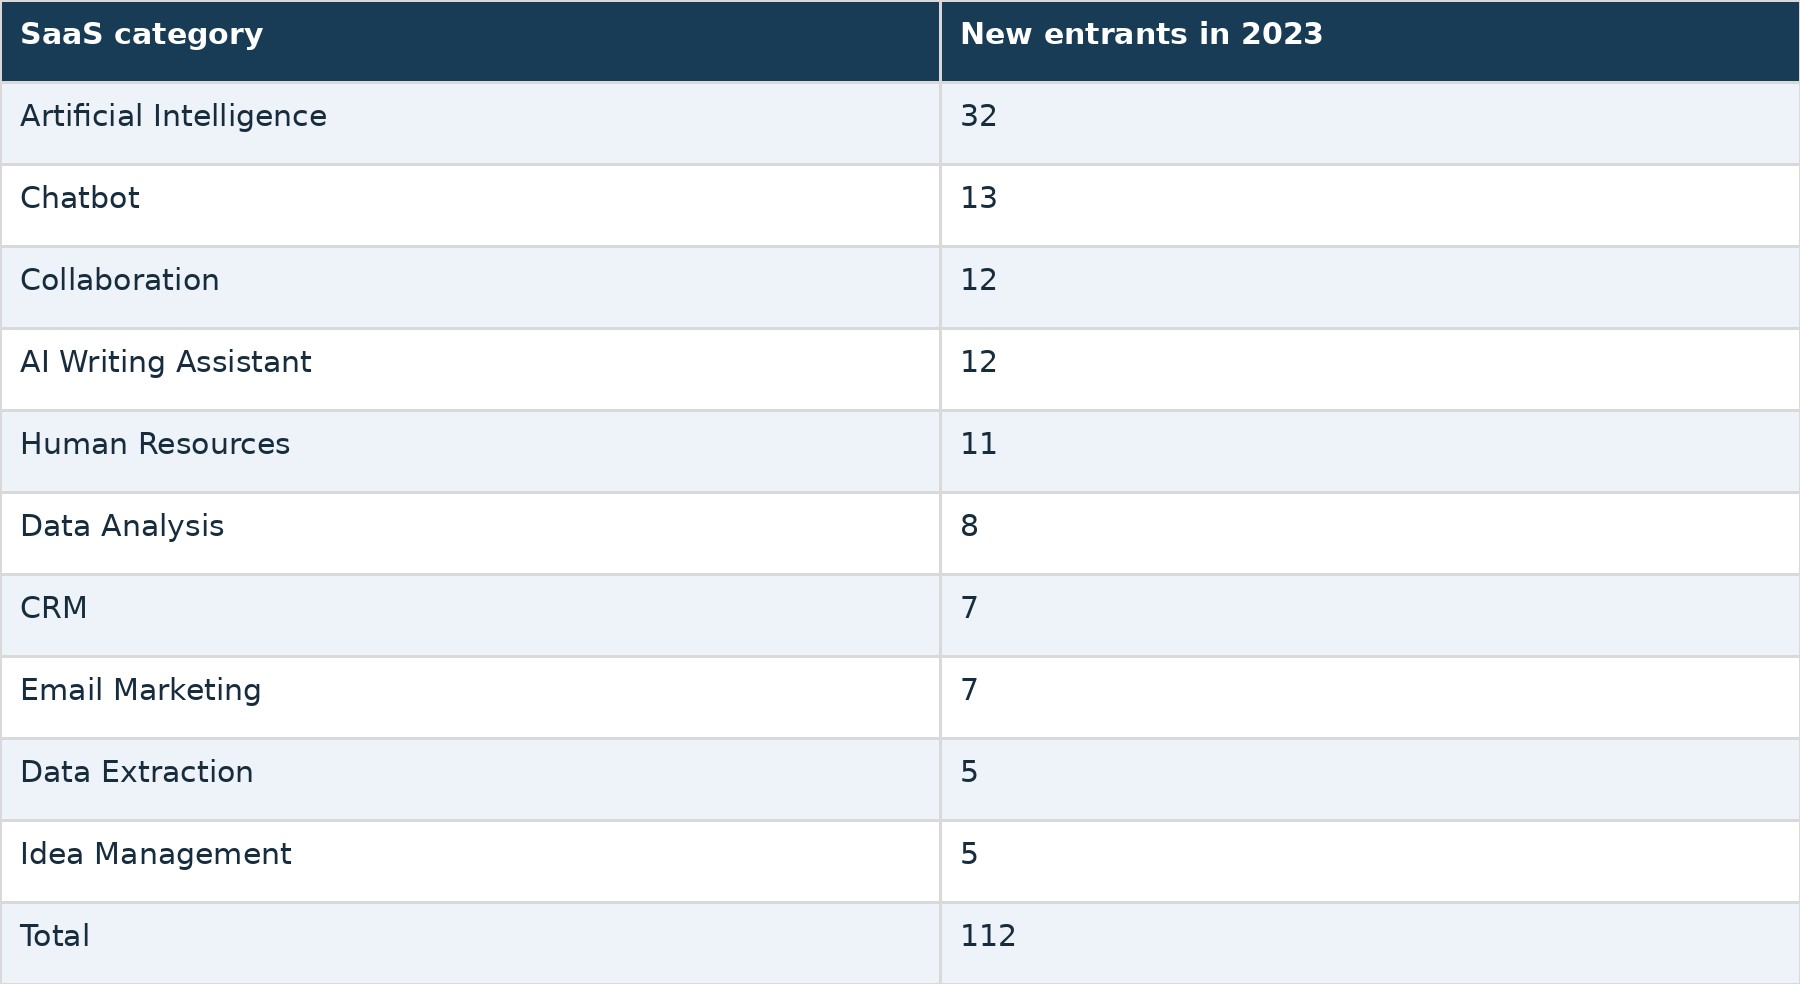
Together, these ten categories accounted for 31.5% of all new products recorded in the dataset. The concentration suggests that new product activity was not evenly distributed across the software directory. However, entrant counts alone do not establish how competitive a category is, how much revenue it generates, or whether its new products will succeed.
How Many New SaaS Products Entered AI-Related Categories?
Five explicitly AI-focused categories accounted for 62 new products:
- Artificial Intelligence: 32
- Chatbot: 13
- AI Writing Assistant: 12
- Conversational AI Platform: 3
- Generative AI: 2
That represents 17.5% of all 355 recorded entrants. This grouping captures categories explicitly identified as AI-related in the report. It does not include every product that may use artificial intelligence within another software category. The result demonstrates that AI-related categories were prominent among new product entries in 2023, without establishing how many products across the entire directory incorporated AI functionality.
Which SaaS Categories Had the Highest Entry Rates?
Raw entrant counts tend to favor larger software categories. To compare categories of different sizes, the report also calculates an entry rate. The calculation is: Entry rate = New 2023 entrants ÷ Existing category product count × 100. The ranking includes only categories with at least 20 existing products. AI Writing Assistant ranks first, with 12 new entrants against an existing base of 91 products, producing an entry rate of 13.2%. Chatbot follows at 8.7%, with 13 entrants against 149 existing products.
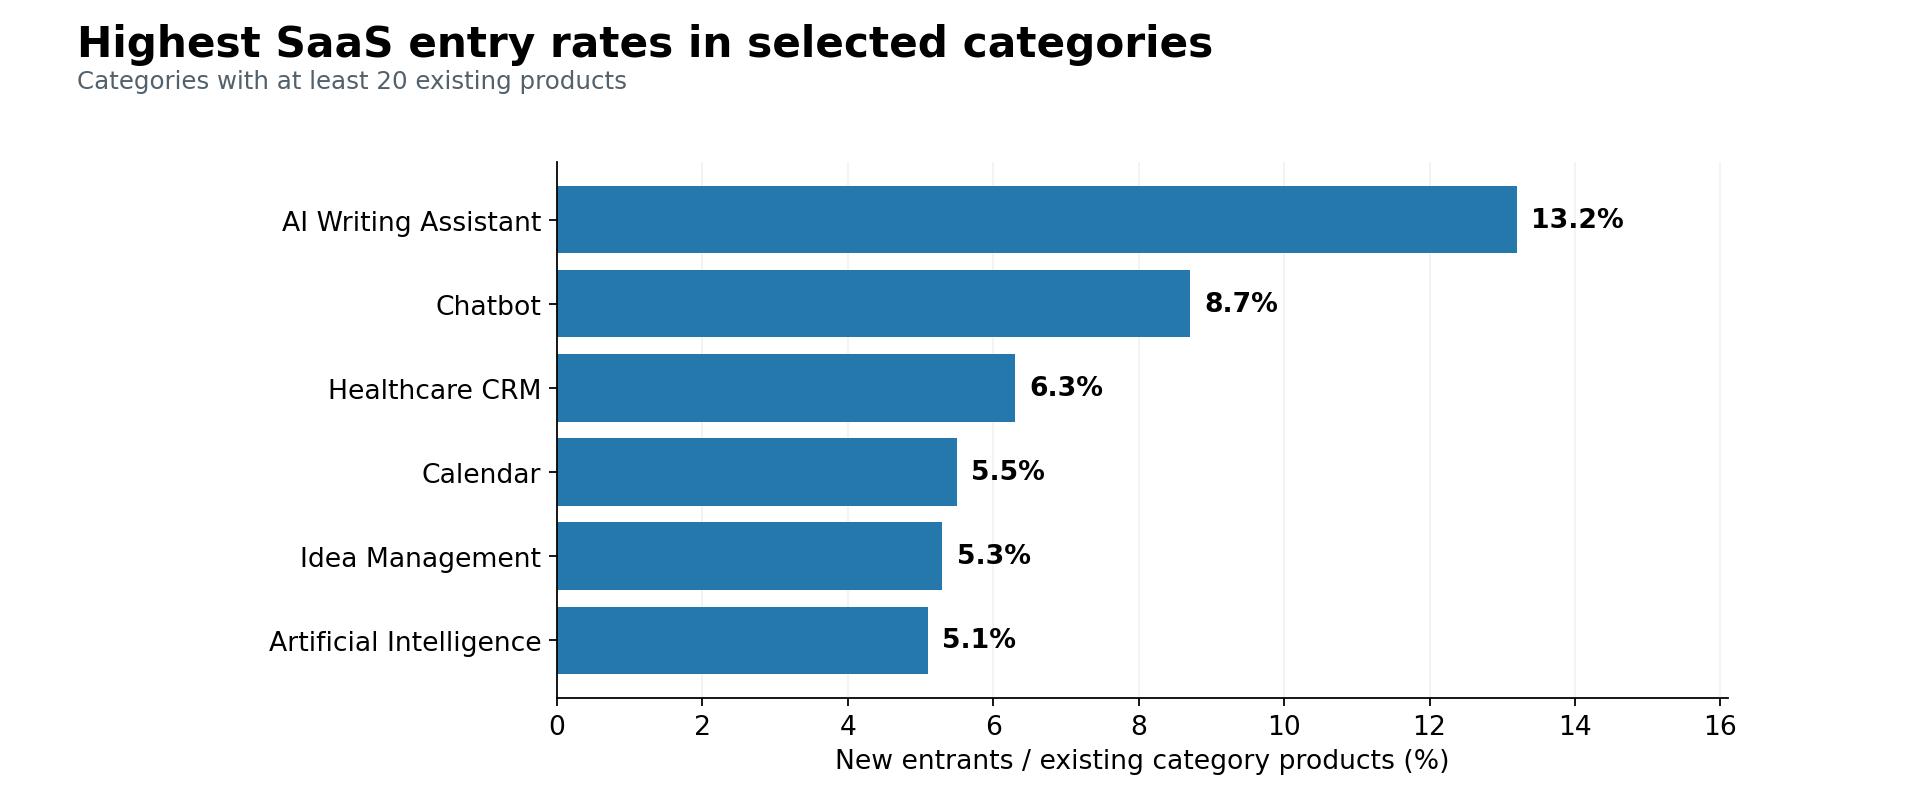
Other categories with relatively high entry rates include Healthcare CRM (6.3%), Calendar (5.5%), Idea Management (5.3%), and Artificial Intelligence (5.1%). This comparison highlights smaller categories that might be overlooked when ranking only by entrant count. For example, Calendar recorded just three new products, compared with 32 for Artificial Intelligence. Yet its entry rate of 5.5% was slightly higher than the AI category's 5.1%. Entry rate is useful for describing new supply relative to an existing product base. It should not be confused with revenue growth, user adoption, or the percentage growth of the entire software market.
How Concentrated Were New SaaS Entrants Across Categories?
Of the 1,142 categories tracked, just 170 recorded a new product in 2023. The remaining 972 categories, approximately 85.1% of the total, recorded none. Even among the categories that attracted entrants, most received only a small number.
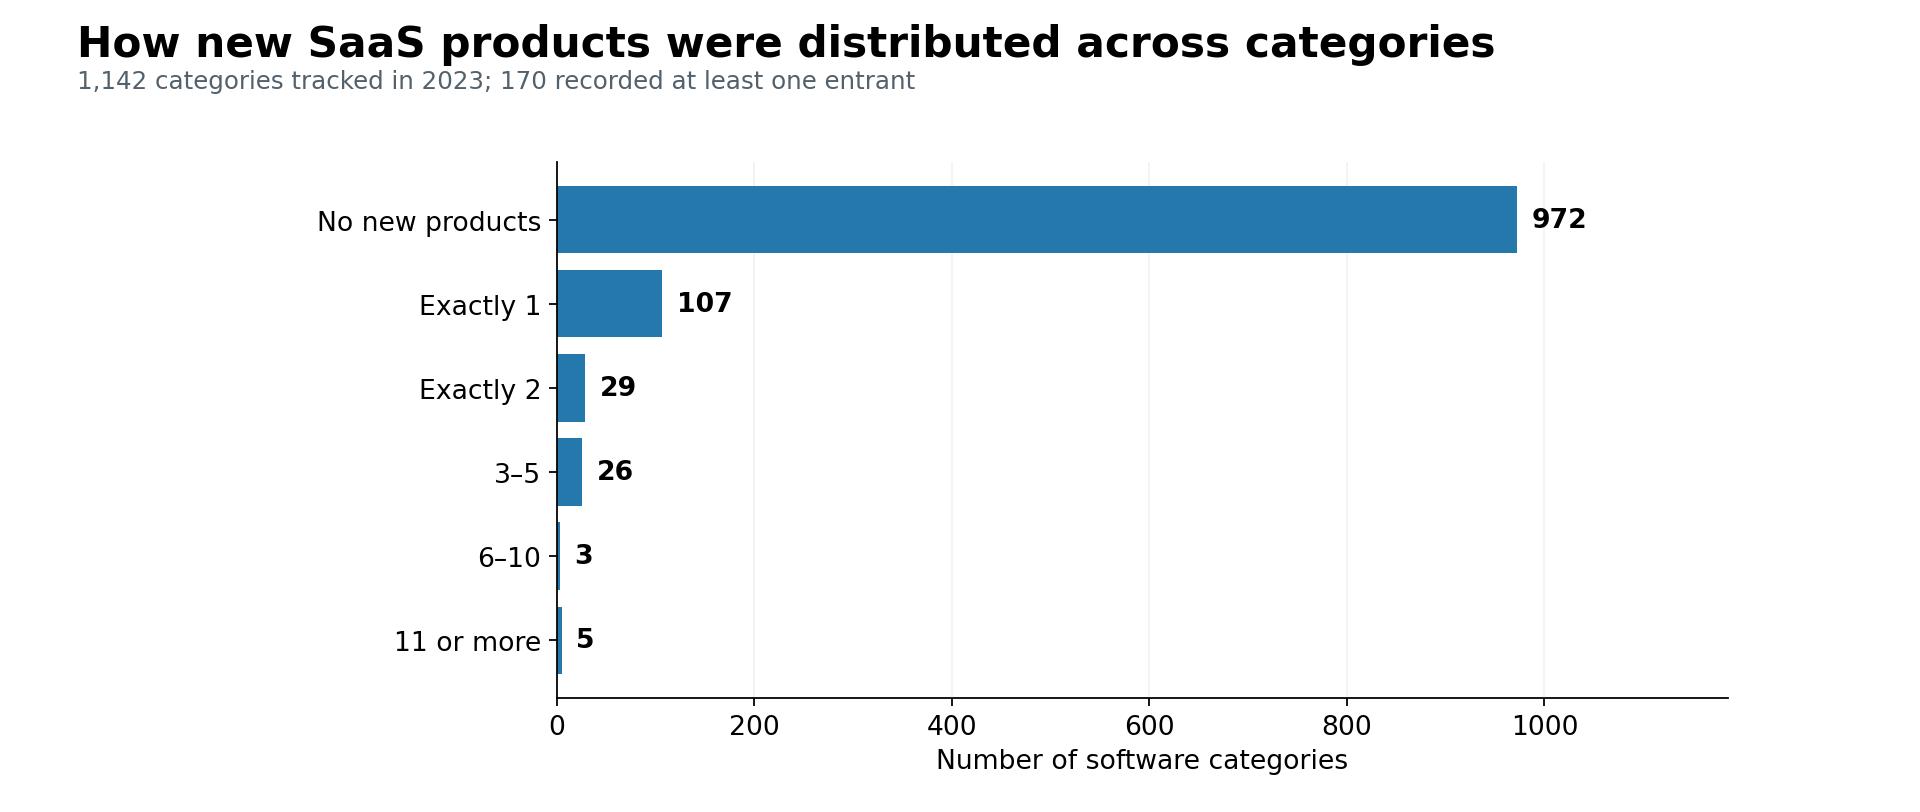
The distribution was:
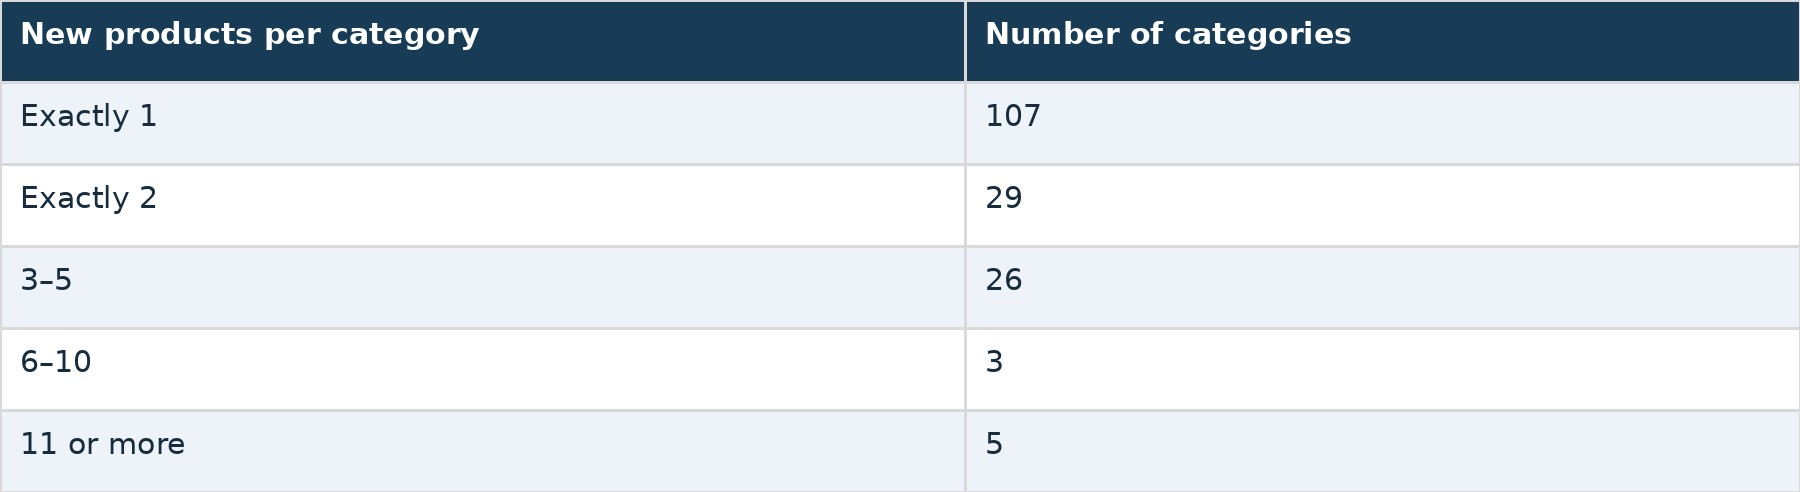
The largest group consisted of 107 categories with exactly one new entrant. Another 29 categories recorded two entrants each. Only eight categories attracted six or more new products. This shows a pronounced concentration of new product activity: a small number of categories attracted multiple entrants, while most active categories recorded just one or two. For software founders and researchers, this is a useful way to distinguish categories with frequent new product entries from those with limited recorded activity. It does not, however, establish why some categories attracted more entrants than others.
Do SaaS Categories With New Entrants Have Higher Prices?
The report compares average category prices for software categories that recorded new products against those that did not. Of the 1,142 categories, 799 have recorded average prices. Among those priced categories: 163 recorded at least one new entrant. 636 recorded no new entrants. Categories with new products had both higher median and higher mean average prices.
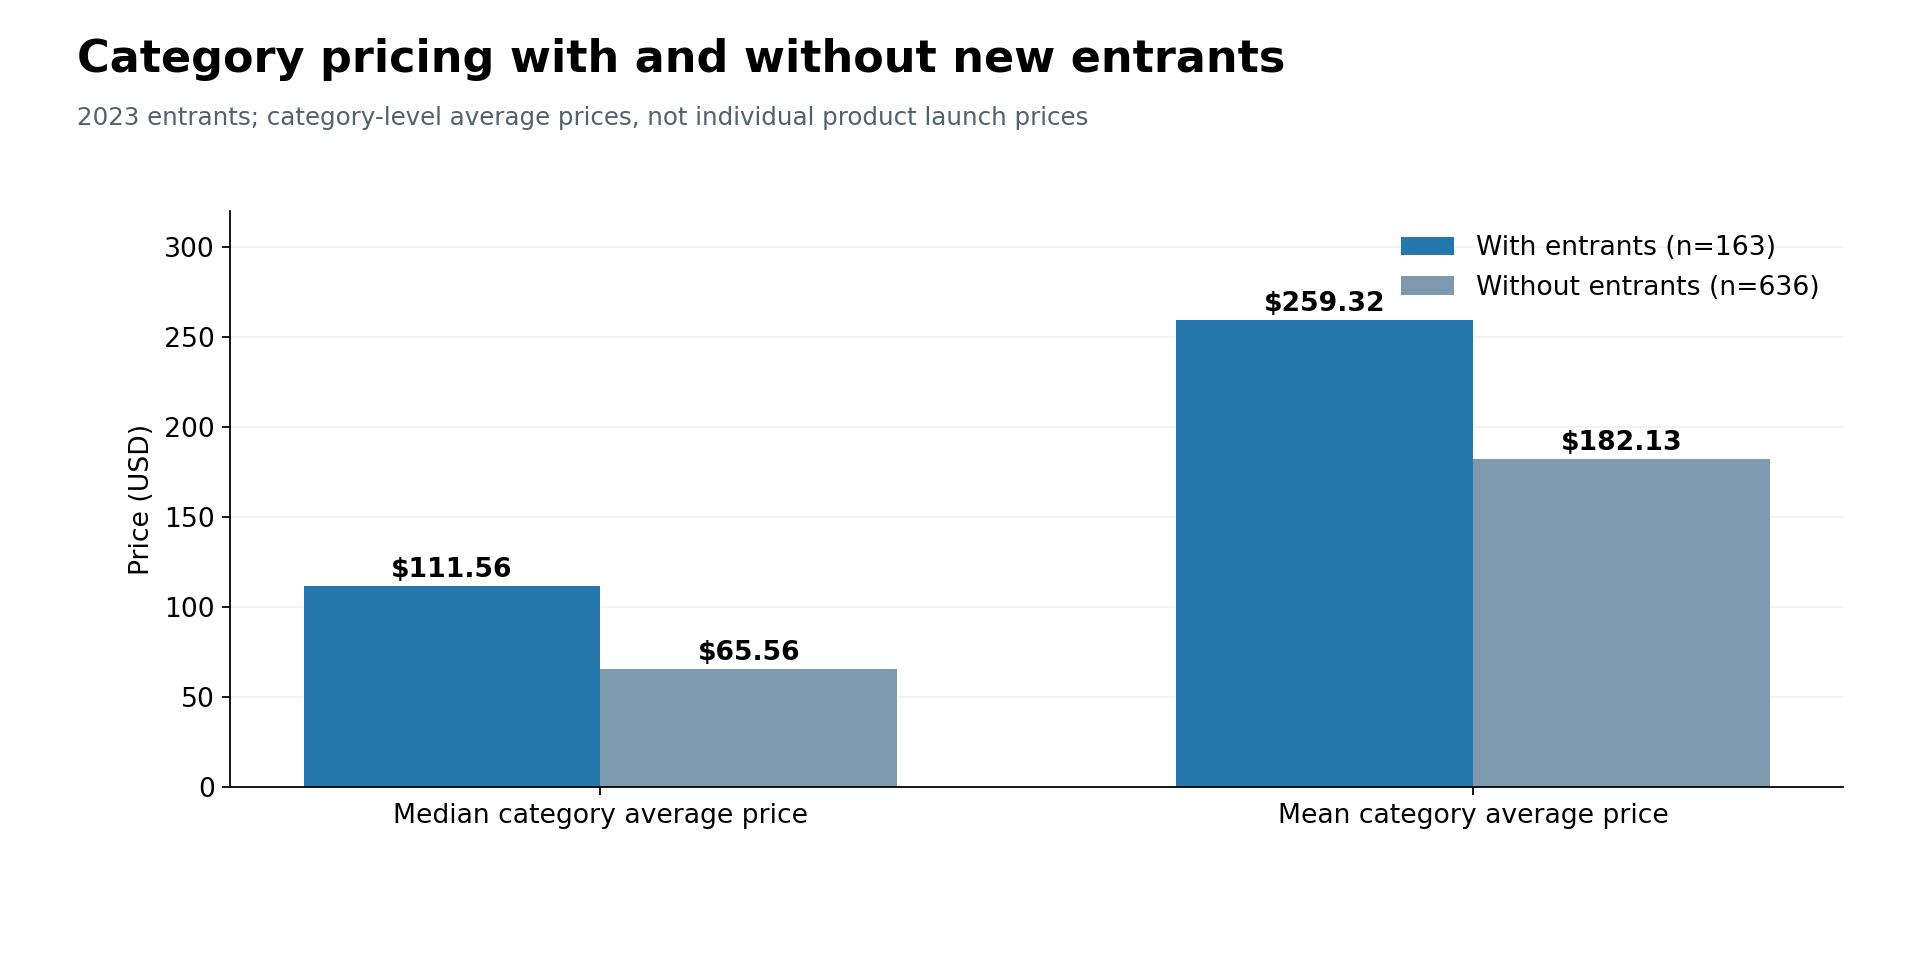

The median category average price was approximately 70% higher among categories that attracted new entrants. The difference is also supported by the report's statistical analysis. Both the log-adjusted t-test and the Mann–Whitney U test returned p-values below 0.001. However, the raw-price t-test was not statistically significant (p = 0.258). This distinction matters. The data provides evidence of a pricing difference under some statistical comparisons, but it does not prove that higher prices attract new software products. The analysis also uses category-level average prices, not prices paid by customers or the launch prices of the new products themselves.
Does SaaS Pricing Predict the Number of New Entrants?
The report examines two possible relationships with new product counts: existing category size and average price. Across the 799 priced categories, the Pearson correlation between average price and the number of new entrants was just 0.066. The report identifies this as statistically nonsignificant, with p = 0.064. By comparison, existing category size had a Pearson correlation of 0.453 with entrant counts, with p below 0.001.
In other words, the number of existing products in a category was much more closely associated with the number of new products recorded in 2023 than its average price was. The rank-based results also showed positive associations: Spearman's rho was 0.366 for existing category size and 0.174 for price. These findings suggest that existing category size is the stronger descriptive indicator of where new products appeared within this dataset. They do not establish that large categories cause more products to launch or that pricing has no relationship with entry under other measures.
What About High-Priced SaaS Categories?
Several categories with new entrants also had relatively high recorded average prices. Chatbot, for example, had an average category price of $1,905.21 and recorded 13 entrants. Cloud Management averaged $1,086.91 and recorded four entrants, while Recruiting averaged $1,045.80 with four entrants. Data Analysis had eight entrants and an average price of $924.06.
By contrast, Idea Management averaged $39.20 and attracted five new products, while Calendar averaged $21.64 and attracted three. These examples illustrate the wide range of category prices associated with new product activity. However, they should not be interpreted as a ranking of the most expensive SaaS categories overall. Other categories in the dataset have higher recorded average prices.
What Do the 2023 SaaS Entrant Findings Mean?
Three findings stand out from the analysis. First, new product activity was highly concentrated. Only 14.9% of tracked categories recorded entrants, and the ten most active categories accounted for nearly one-third of all new products. Second, AI-related categories were prominent. Artificial Intelligence led in absolute entrant count, while AI Writing Assistant led in relative entry rate among categories meeting the minimum-size threshold.
Third, existing category size had a stronger statistical relationship with entrant counts than average price. Although categories with new products tended to have higher recorded prices, price alone was only weakly correlated with how many entrants appeared. Together, these results offer a useful picture of where new SaaS products were recorded in 2023. They should be treated as descriptive directory research, not a forecast of which categories will grow fastest or produce the most successful businesses.
Methodology and Data Limitations
This analysis is based on Solevant's New SaaS Entrants 2023 dataset. The dataset contains 1,142 software categories, each with an existing product count, an average price where available, and a count of products recorded as new entrants in 2023. The report identifies 355 new entrants across 170 categories. Entry rates are calculated by dividing the number of 2023 entrants by the existing product count for each category. The entry-rate ranking excludes categories with fewer than 20 existing products.
Price comparisons and statistical tests use 799 categories with recorded average prices. The remaining 343 categories are excluded from pricing analysis. The report uses Pearson and Spearman correlations, Welch t-tests, and a Mann–Whitney U test to examine associations between pricing, existing market size, and new product activity. Several limitations apply: The analysis is aggregated by category rather than based on individual product records.
Categories with one or two entrants may produce unstable relative comparisons. Average category prices may conceal substantial variation between products. The report does not provide a data collection date, update frequency, or broader historical comparison. Statistical associations do not establish why vendors entered particular categories. The findings therefore describe the products and categories represented in Solevant's supplied dataset, not every SaaS product launched worldwide in 2023.
Frequently Asked Questions
How many new SaaS products entered the market in 2023?
Solevant's dataset records 355 new SaaS products across 170 software categories in 2023.
Which SaaS category attracted the most new entrants?
Artificial Intelligence led with 32 new products, followed by Chatbot with 13.
How many new products entered AI-related categories?
Five explicitly AI-focused categories accounted for 62 entrants, representing 17.5% of the total.
Which category had the highest relative entry rate?
AI Writing Assistant led with a 13.2% entry rate, among categories with at least 20 existing products.
Did higher-priced SaaS categories attract more new products?
Categories with entrants generally had higher recorded average prices, but average price had only a weak Pearson correlation with entrant counts (r = 0.066).
What was more strongly associated with new SaaS entrants?
Existing category size had the stronger correlation with entrant counts, at Pearson r = 0.453.
Conclusion
The 2023 SaaS entrant data reveals a market-directory landscape in which new products were concentrated in a relatively small number of software categories. Artificial Intelligence led in total entries, AI Writing Assistant had the highest relative entry rate, and most tracked categories recorded no new products. Pricing differences were visible between categories with and without entrants, but existing category size was much more closely associated with entrant counts. For SaaS researchers, founders, and industry analysts, the findings offer a useful starting point for understanding where new software products appeared in 2023—while underscoring the need for additional data before drawing conclusions about market demand, profitability, or future growth.